
Global River Basins: Annual Mean Temperature Map
Feb 28, 2025
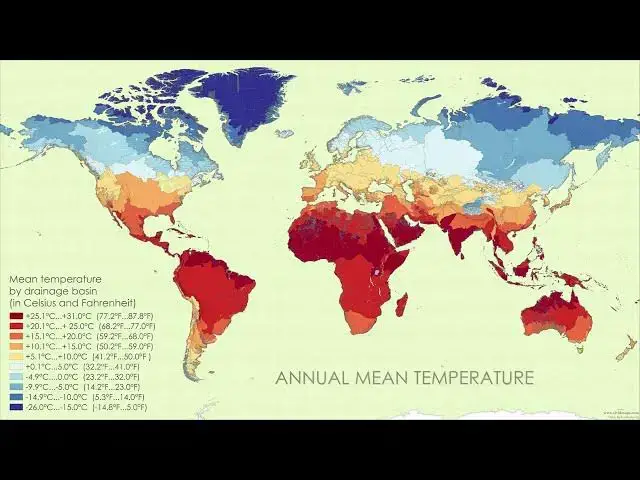
Dive into a fascinating visualization of our planet's climate! This video showcases a world map revealing the median annual mean temperatures across Earth's major river basins.
Using WorldClim's BIO1 (Annual Mean Temperature) data and ArcGIS Zonal Statistics, we've calculated the median temperature for each river basin. Watch as the map comes to life, displaying a vibrant tapestry of temperature variations within these crucial watersheds.
This unique perspective offers valuable insights into global temperature patterns and highlights the intricate relationship between river systems and regional climates. It's an essential view for climate researchers, geographers, environmental enthusiasts, and anyone curious about our planet's diverse thermal landscapes!
For an in-depth analysis and additional insights, check out our detailed blog post:
https://vividmaps.com/river-basins-as-countries/
Interested in exploring more world maps? Check out these options on Amazon:
National Geographic World Executive Map: https://amzn.to/3B5hiHm
Antique World Map Poster: https://amzn.to/3AZAsOS
Scratch-Off World Travel Map: https://amzn.to/4dlCUNb
Don't forget to like, subscribe, and share your thoughts in the comments!
#RiverBasins #ClimateVisualization #GlobalTemperatures
Show More Show Less #Earth Sciences