
The New Majority: Mapping 50% Population Thresholds by Race/Ethnicity in the U.S.
Feb 28, 2025
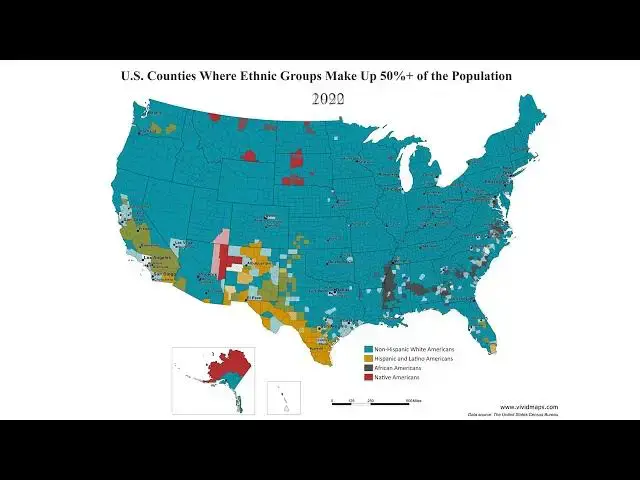
Witness the dynamic changes in the racial and ethnic composition of U.S. counties through this captivating animated map. Explore the shifting landscapes where non-Hispanic white, Black, and Hispanic Americans have represented at least 50% of the local population from 1990 to 2022. This video offers a revealing look at the evolving demographic mosaic that is shaping modern America.
For more insights, be sure to check out the blog post at https://vividmaps.com/new-majority-in-america/
You can also find related map posters of the United States on Amazon:
- National Geographic United States Wall Map: https://amzn.to/4i07eAu
- USA Classic Elite Wall Map Mural Poster: https://amzn.to/4eGLvua
- Laminated World Map Poster & USA Map Set: https://amzn.to/4hPomIS
Show More Show Less