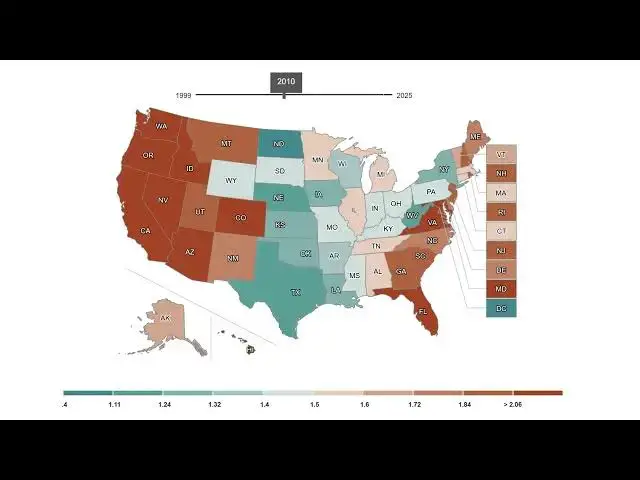

US State Household Debt-to-Income Ratios: 1999-2025
Dec 4, 2025
Watch how household debt-to-income ratios evolved across all 50 US states from 1999 to 2025. This animated visualization uses Federal Reserve data (https://www.federalreserve.gov/releases/z1/dataviz/household_debt/state/table/) to show which states saw dramatic increases in financial burdens and which remained stable over the past quarter-century.
Read more: https://vividmaps.com/debt-to-income-ratio/
Show More Show Less