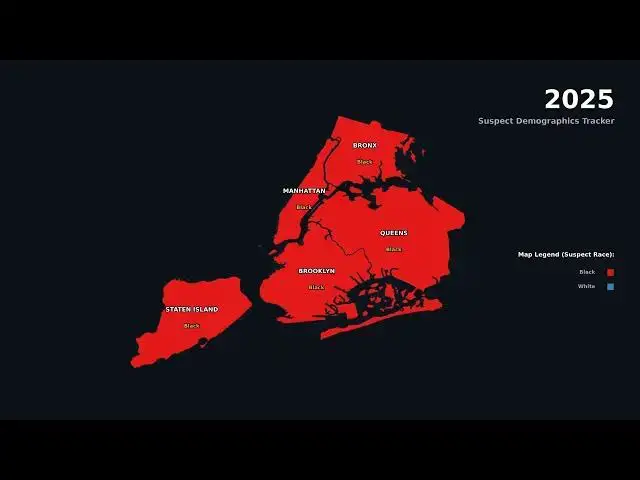

NYPD Suspect Race Data by NYC Borough, 2006 to 2025, Mapped
Sep 19, 2026

This animated map uses NYPD Complaint Data Historic to track which suspect race NYPD recorded most often in each borough, year by year, counting only cases where a suspect race was actually recorded. Black was the most frequently recorded category in the Bronx, Brooklyn, Manhattan, and Queens across the entire 2006 to 2025 period. Staten Island is the exception, recording White most often through 2016 before switching to Black from 2017 on. NYPD suspect race reflects how a complainant or officer described a suspect rather than a confirmed identity, and a large share of all complaints carry no suspect race at all, so this map covers reported cases only, not total complaint volume, and it does not account for population size in each borough.
Read more: https://vividmaps.com/new-york-city-crime-map/
Grab a physical map to go with the data.
- NYC city map on Amazon: https://amzn.to/3Tz8ItU
- National Geographic New York Wall Map on Amazon: https://amzn.to/4xYyp61
As an Amazon Associate, I earn from qualifying purchases.
Show More Show Less