Most people don’t want to put too much effort into considering their options when using Uber and Lyft. However, taking a little extra time to think things through could potentially save you some money.
They’re the guilty pleasures — luxuries, in some cases — that we indulge in to make life more comfortable. “Transport Network Companies” make it easier and more certain to hail a ride by removing any awkwardness and uncertainty involved. When using a rideshare app, you can quickly view the estimated wait time, the fare cost, and even track your driver’s location.
When you’re in an unfamiliar location, ride-sharing services like Uber or Lyft are the go-to option for transportation. They’re like the McDonald’s of getting around, with the app serving as the iconic golden arches. You’re familiar with the ordering process and can expect a consistent experience no matter where you are in the country.
However, there are occasions where certain inconveniences may arise. The waiting time is quite lengthy. The price exceeds your expectations by a significant amount. Although you can switch between the Uber and Lyft apps, doing so can be time-consuming and a distraction from the task at hand.
CashNetUSA‘s personal finance experts have conducted tests on services in 150 major cities across the United States to assist you in determining which app to begin with. They have discovered which service is usually more cost-effective in these cities as well as in each state.
Uber is the more affordable option in the majority (33) of U.S. states.
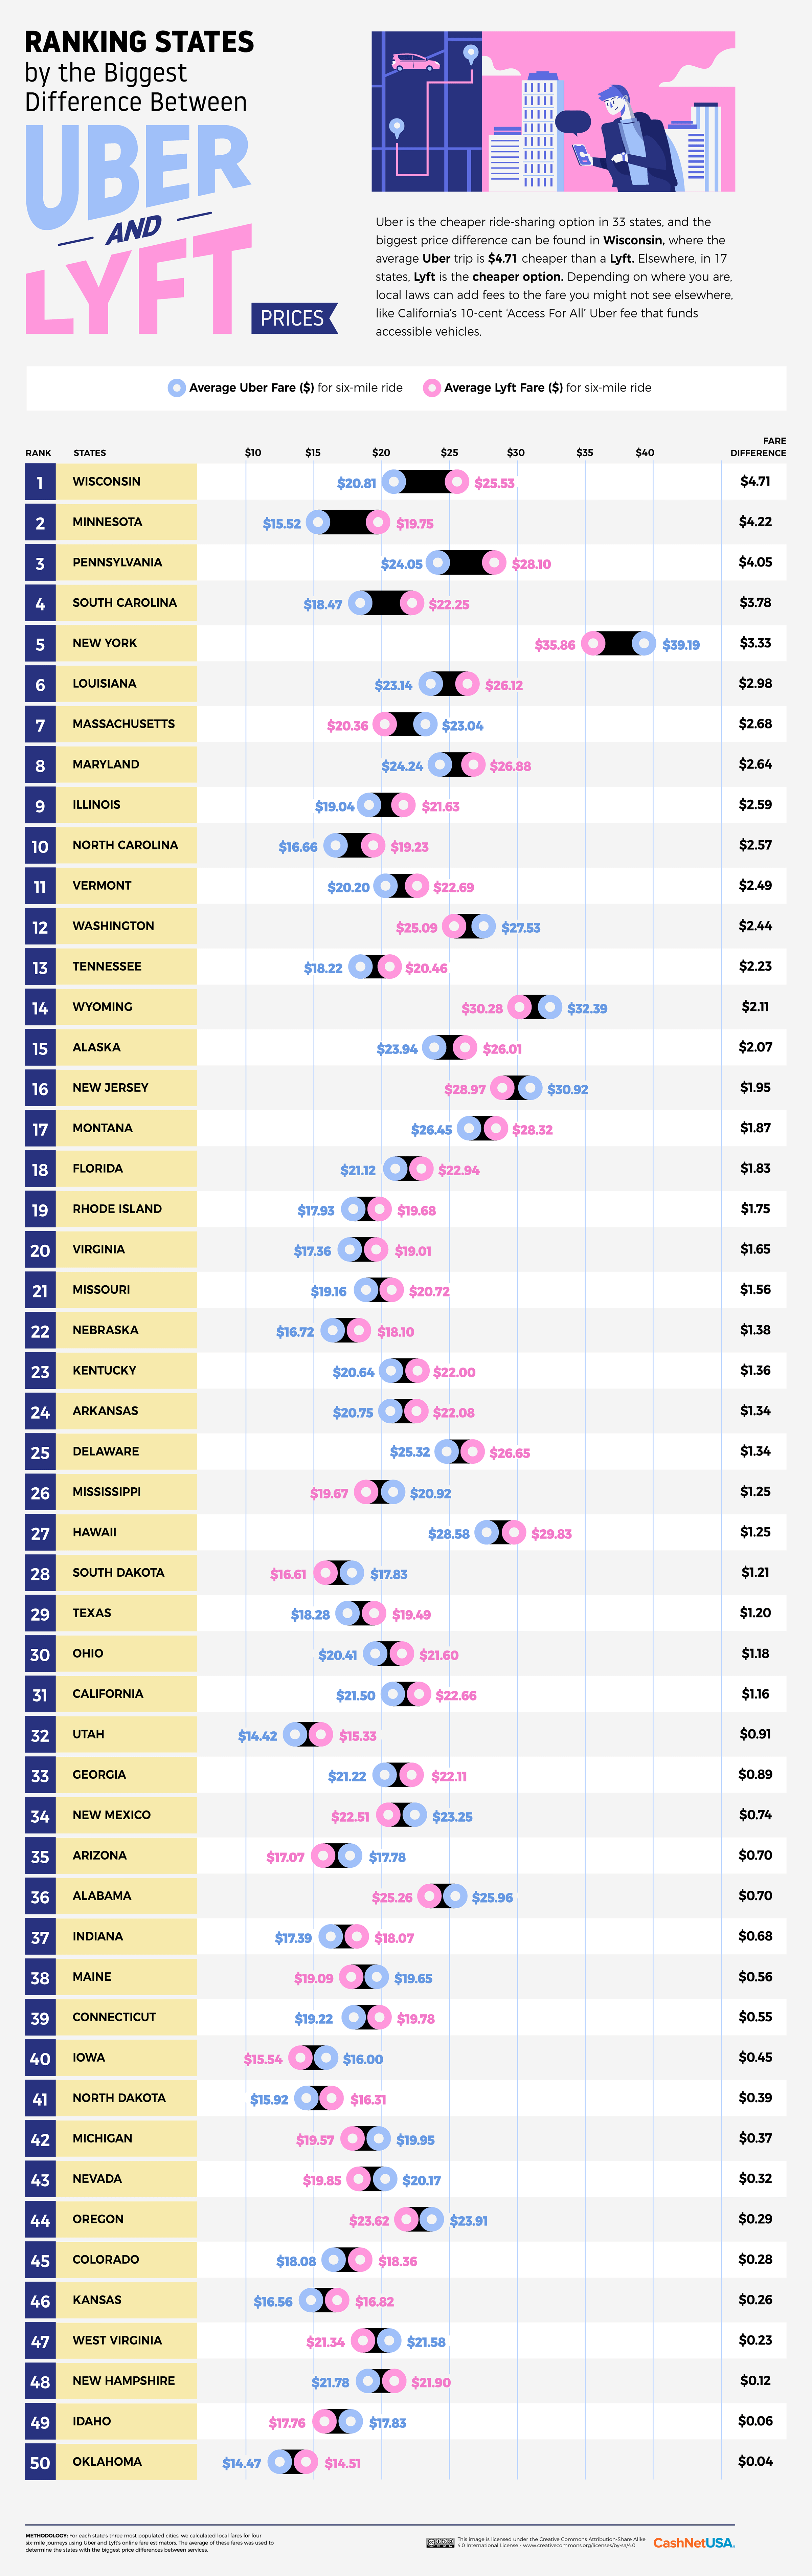
Wisconsin is the state with the significant gap between companies: a six-mile ride costs $4.71 less with an Uber.
Uber is $12.20 cheaper than Lyft in New Orleans, LA, the most substantial disparity at the city level.
Uber and Lyft fares are highest in New York state, where they’re on average $39.19 and $35.86, resulting in Lyft being the more affordable option by $3.33.
Utah has some of the most affordable Uber prices, where trips cost $14.42 on average, and average Lyft prices are lowest in Oklahoma, with trips costing about $14.51.
Uber vs. Lyft: Which is Cheaper (and by how much) in Every State?
Uber is cheaper than Lyft in the majority of American states. Wisconsin sees the biggest difference.
Ranking States by the Biggest Difference Between Uber and Lyft
Uber is the cheaper ride-sharing option in 33 states, and the most significant price difference can be found in Wisconsin, where the average Uber trip is $4.71 cheaper than a Lyft. Elsewhere, in 17 states, Lyft is the cheaper option. Depending on where you are, local laws can add fees to the fare you might not see elsewhere, like California’s 10-cent ‘Access For AH’ Uber fee that funds accessible vehicles.
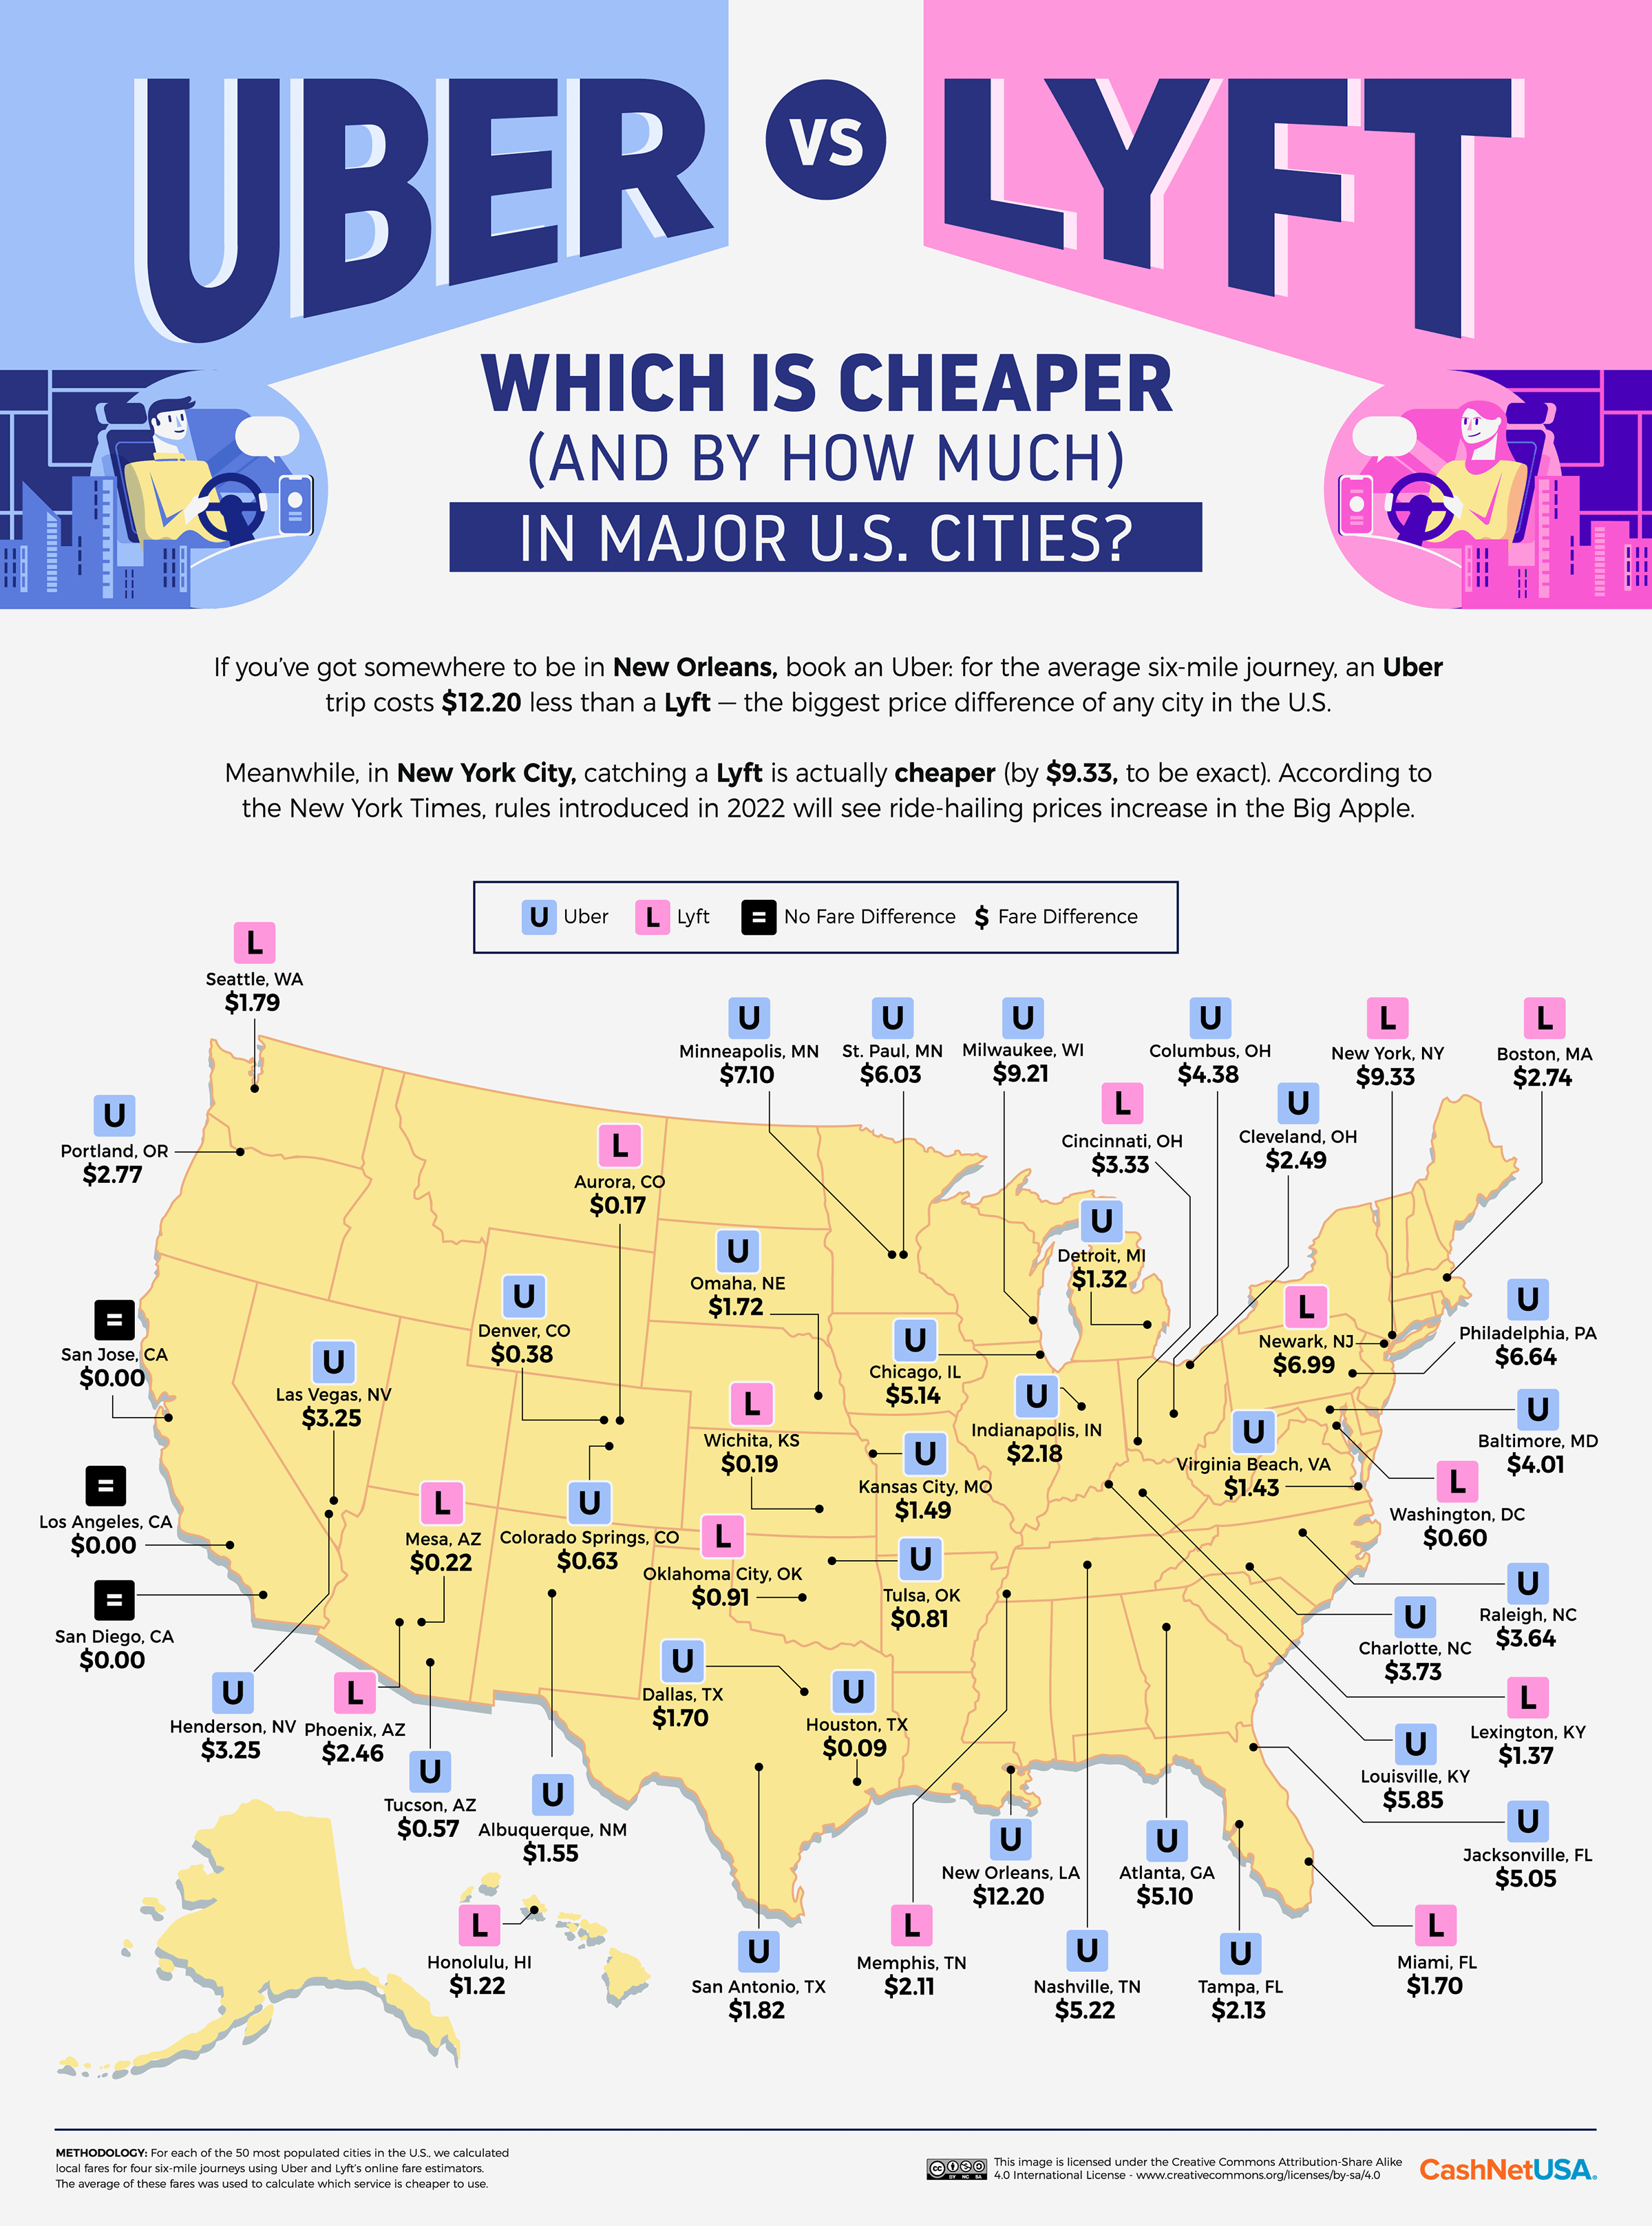
Uber vs. Lyft: Which is Cheaper (and by how much) in Major Cities?
If you’ve got somewhere to be in New Orleans, book an Uber: for the average six-mile journey, an Uber trip costs $12.20 less than a Lyft — the biggest price difference of any city in the United States.
Meanwhile, in New York City, catching a Lyft is actually cheaper (by $9.33, to be exact). According to the New York Times, rules introduced in 2022 will see ride-hailing prices increase in the Big Apple.
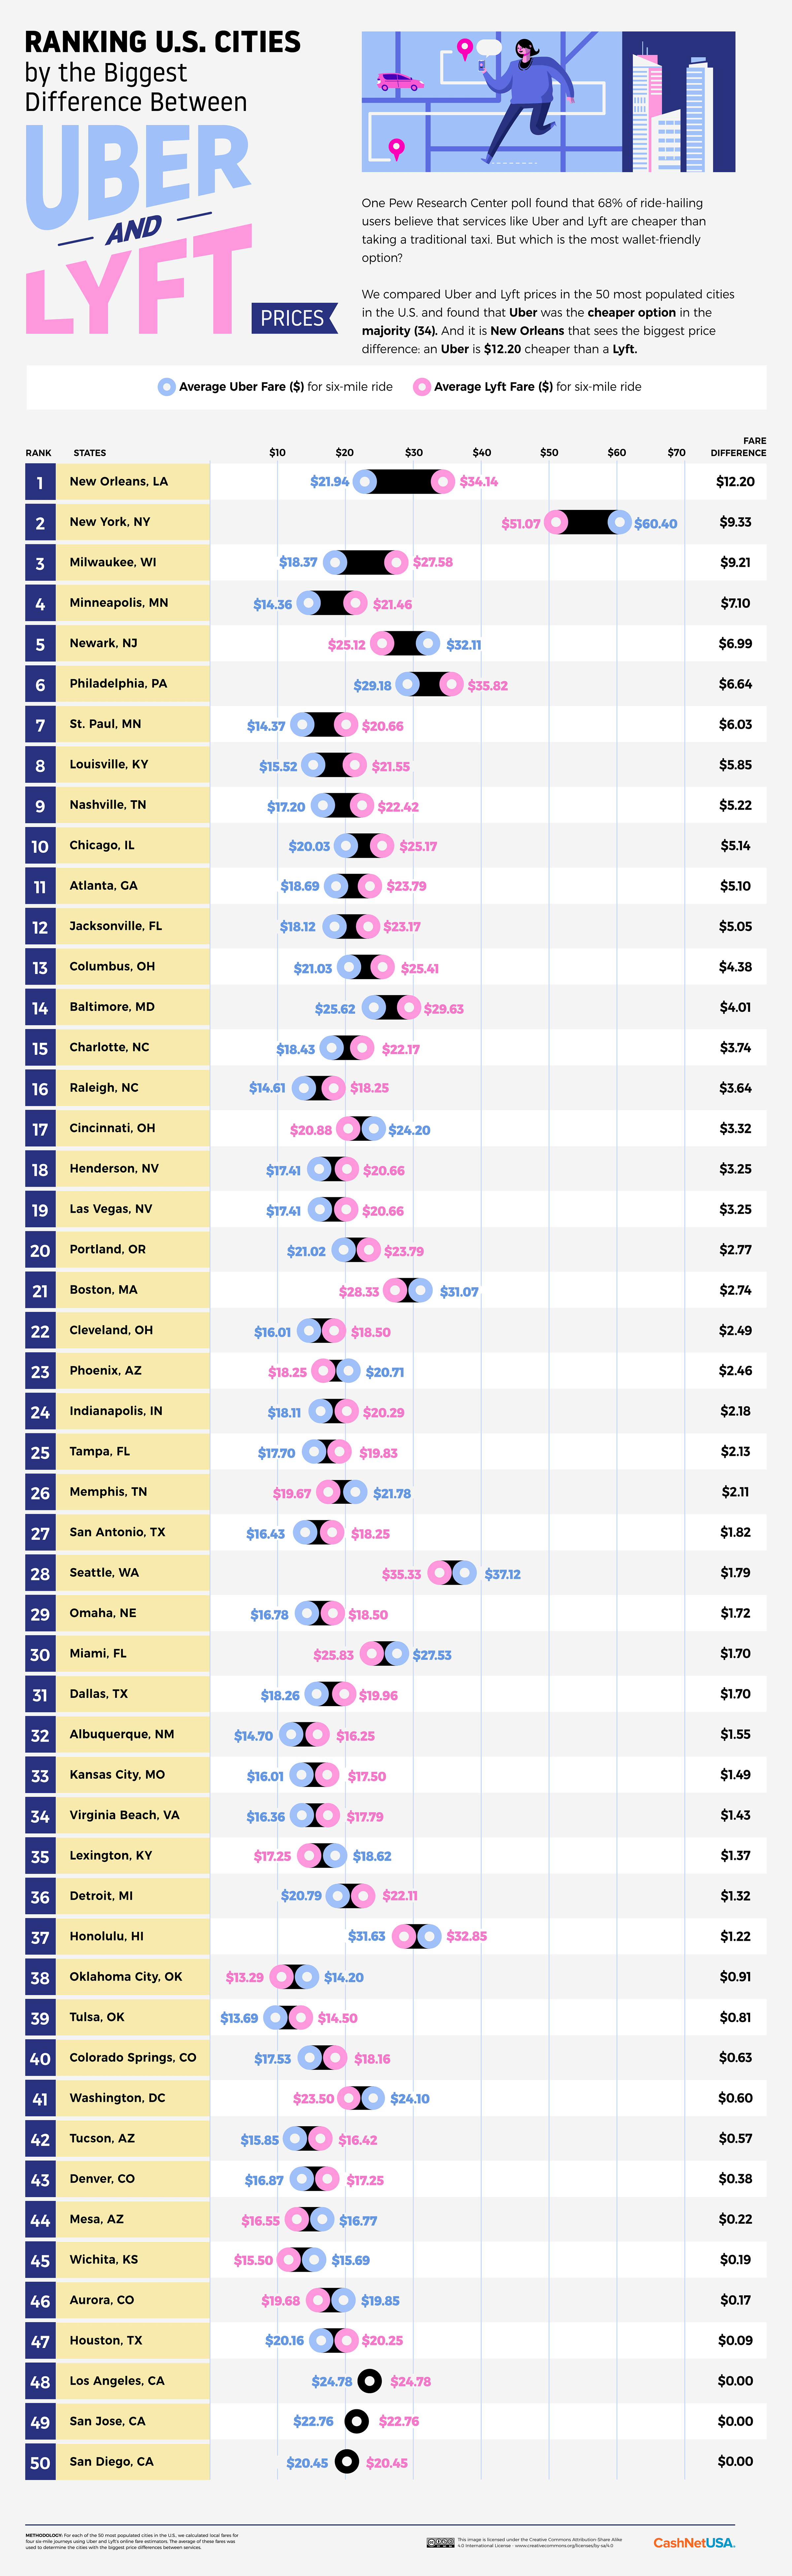
Ranking Cities by the Biggest Difference Between Uber and Lyft
One Pew Research Center poll found that 68% of ride-hailing users believe that services like Uber and Lyft are cheaper than taking a traditional taxi. But which is the most wallet-friendly option?
We compared Uber and Lyft prices in the 50 most populated cities in the U.S. and found that Uber was the cheaper option in the majority (34). And it is New Orleans that sees the biggest price difference: an Uber is $12.20 cheaper than a Lyft.
The Methodology Behind This Study
Analysts at CashNetUSA first curated a seed list of the three most populated cities in each U.S. state and Washington, D.C.
To determine the average fare for a six-mile ride in each city, the CashNetUSA team utilized the official fare estimators provided by Uber and Lyft. The starting point for each journey was the geographical center of the city, with travel in each of the four directions (north, south, east, and west) being considered. To calculate the endpoint of each journey, the team used NOAA’s Latitude/Longitude Distance Calculator. This tool estimates the distance “as the crow flies” between two points on a sphere based on the Great Circle Distance. For each travel in each city, the fare estimates were collected at three different times of day to account for fare differences that arise due to congestion and traffic.
For both Uber and Lyft, the basic ride types were utilized, which are respectively UberX and Lyft. For Lyft fares, which are commonly returned as ranges (e.g., $20-$25), the midpoint of each calculation was taken.
For U.S. cities where the Uber fare estimator didn’t return estimates (San Jose, CA; Los Angeles, CA; San Diego, CA; Las Vegas, NV; and Henderson, NV), fares were measured manually using official Uber and Lyft fare parameters (booking fee, base fare, minimum fare, per minute and mile) for those cities.
In estimating these calculations, the time it would take to complete a six-mile trip was estimated using typical traffic speeds on secondary roads without congestion, with mild congestion, and with intense congestion, based on this analysis to replicate the process of fare estimation at three different times of the day.
State-level assessments were calculated as averages of city-level estimates of the three cities in each U.S. state.