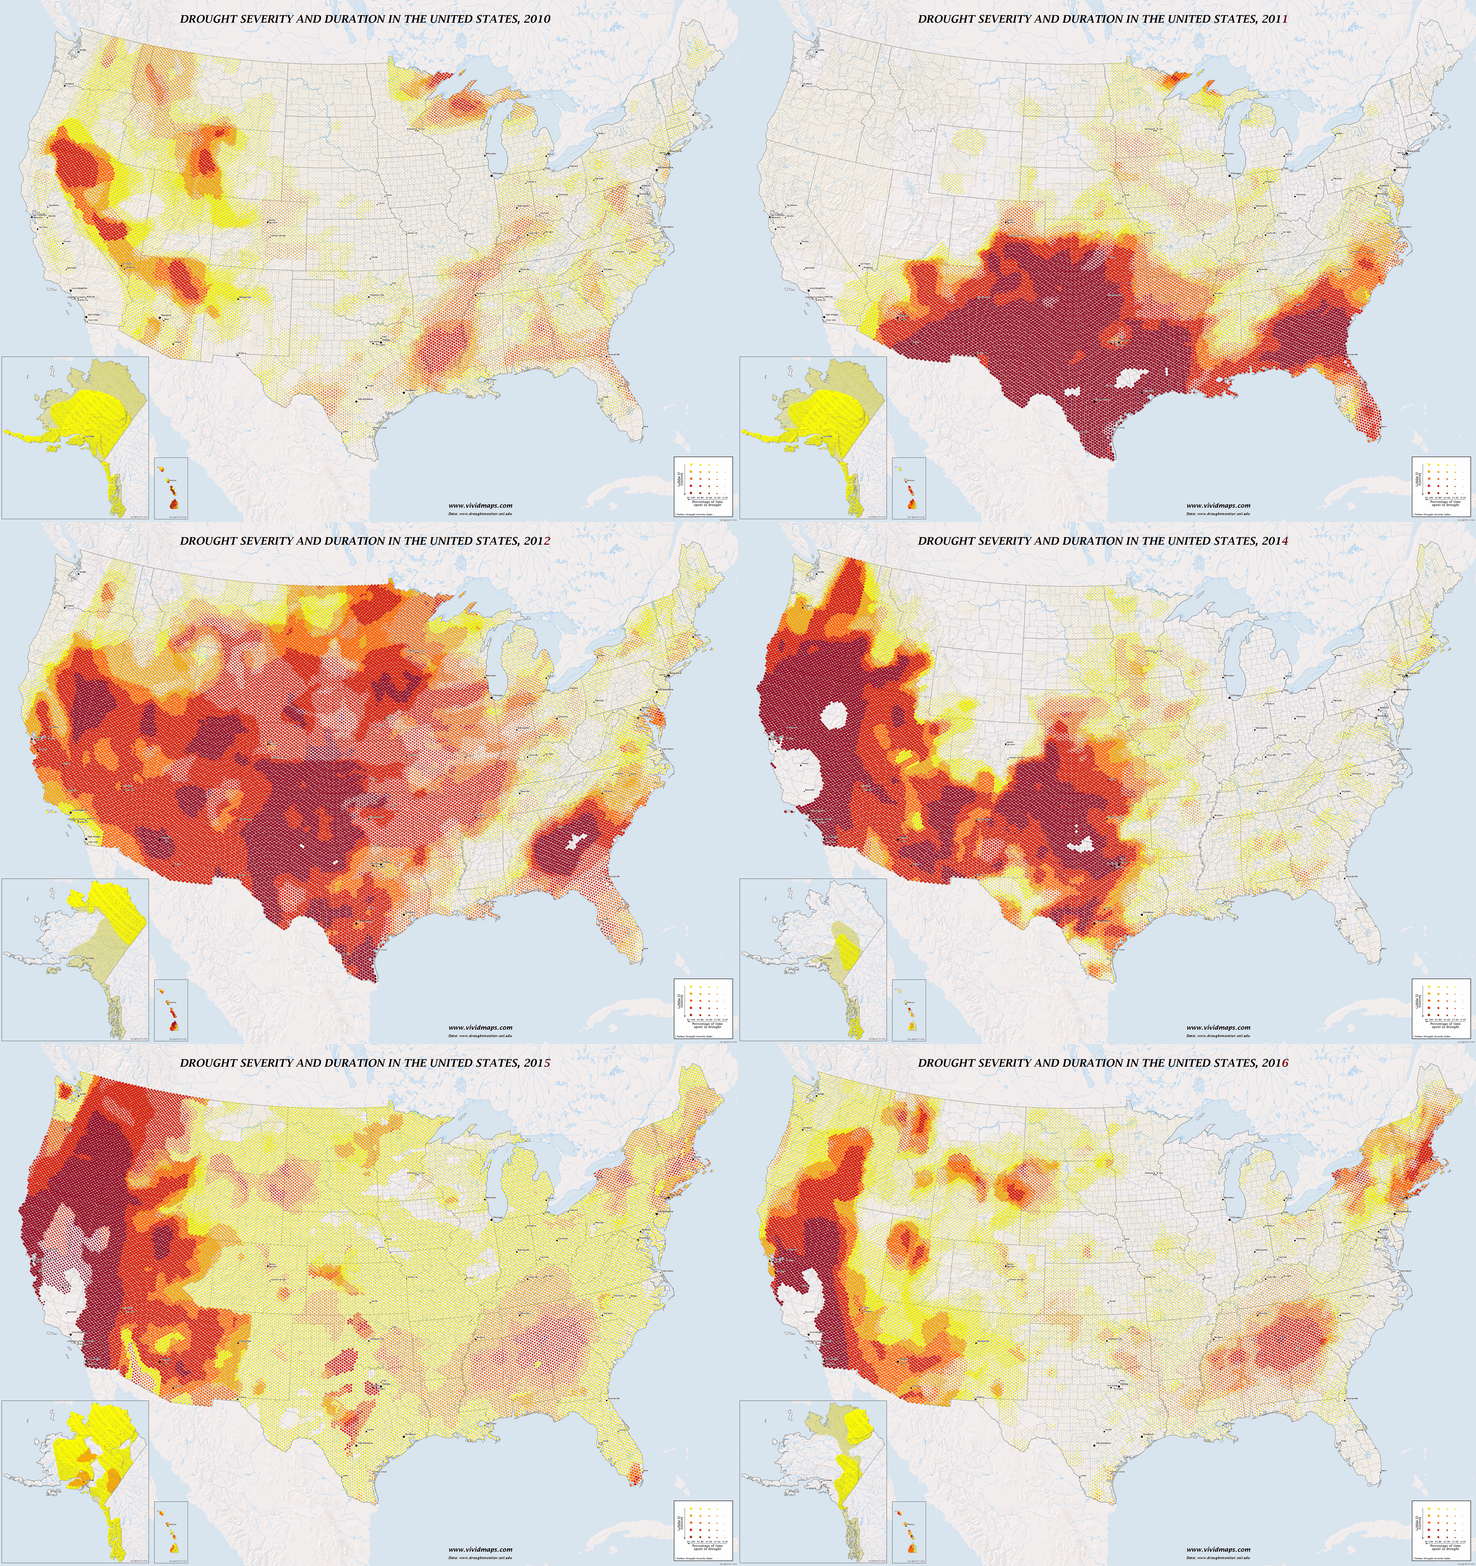
Tracking U.S. Drought Severity
This interactive map shows weekly drought designations by the U.S. Drought Monitor (USDM), which reports conditions across the country. The Drought Monitor publishes a weekly map that shows areas of the country that are in drought, using five classifications: “abnormally dry” (D0), which indicates areas going into or coming out of drought, and four levels of drought: “moderate” (D1), “severe” (D2), “extreme” (D3) and “exceptional” (D4).


