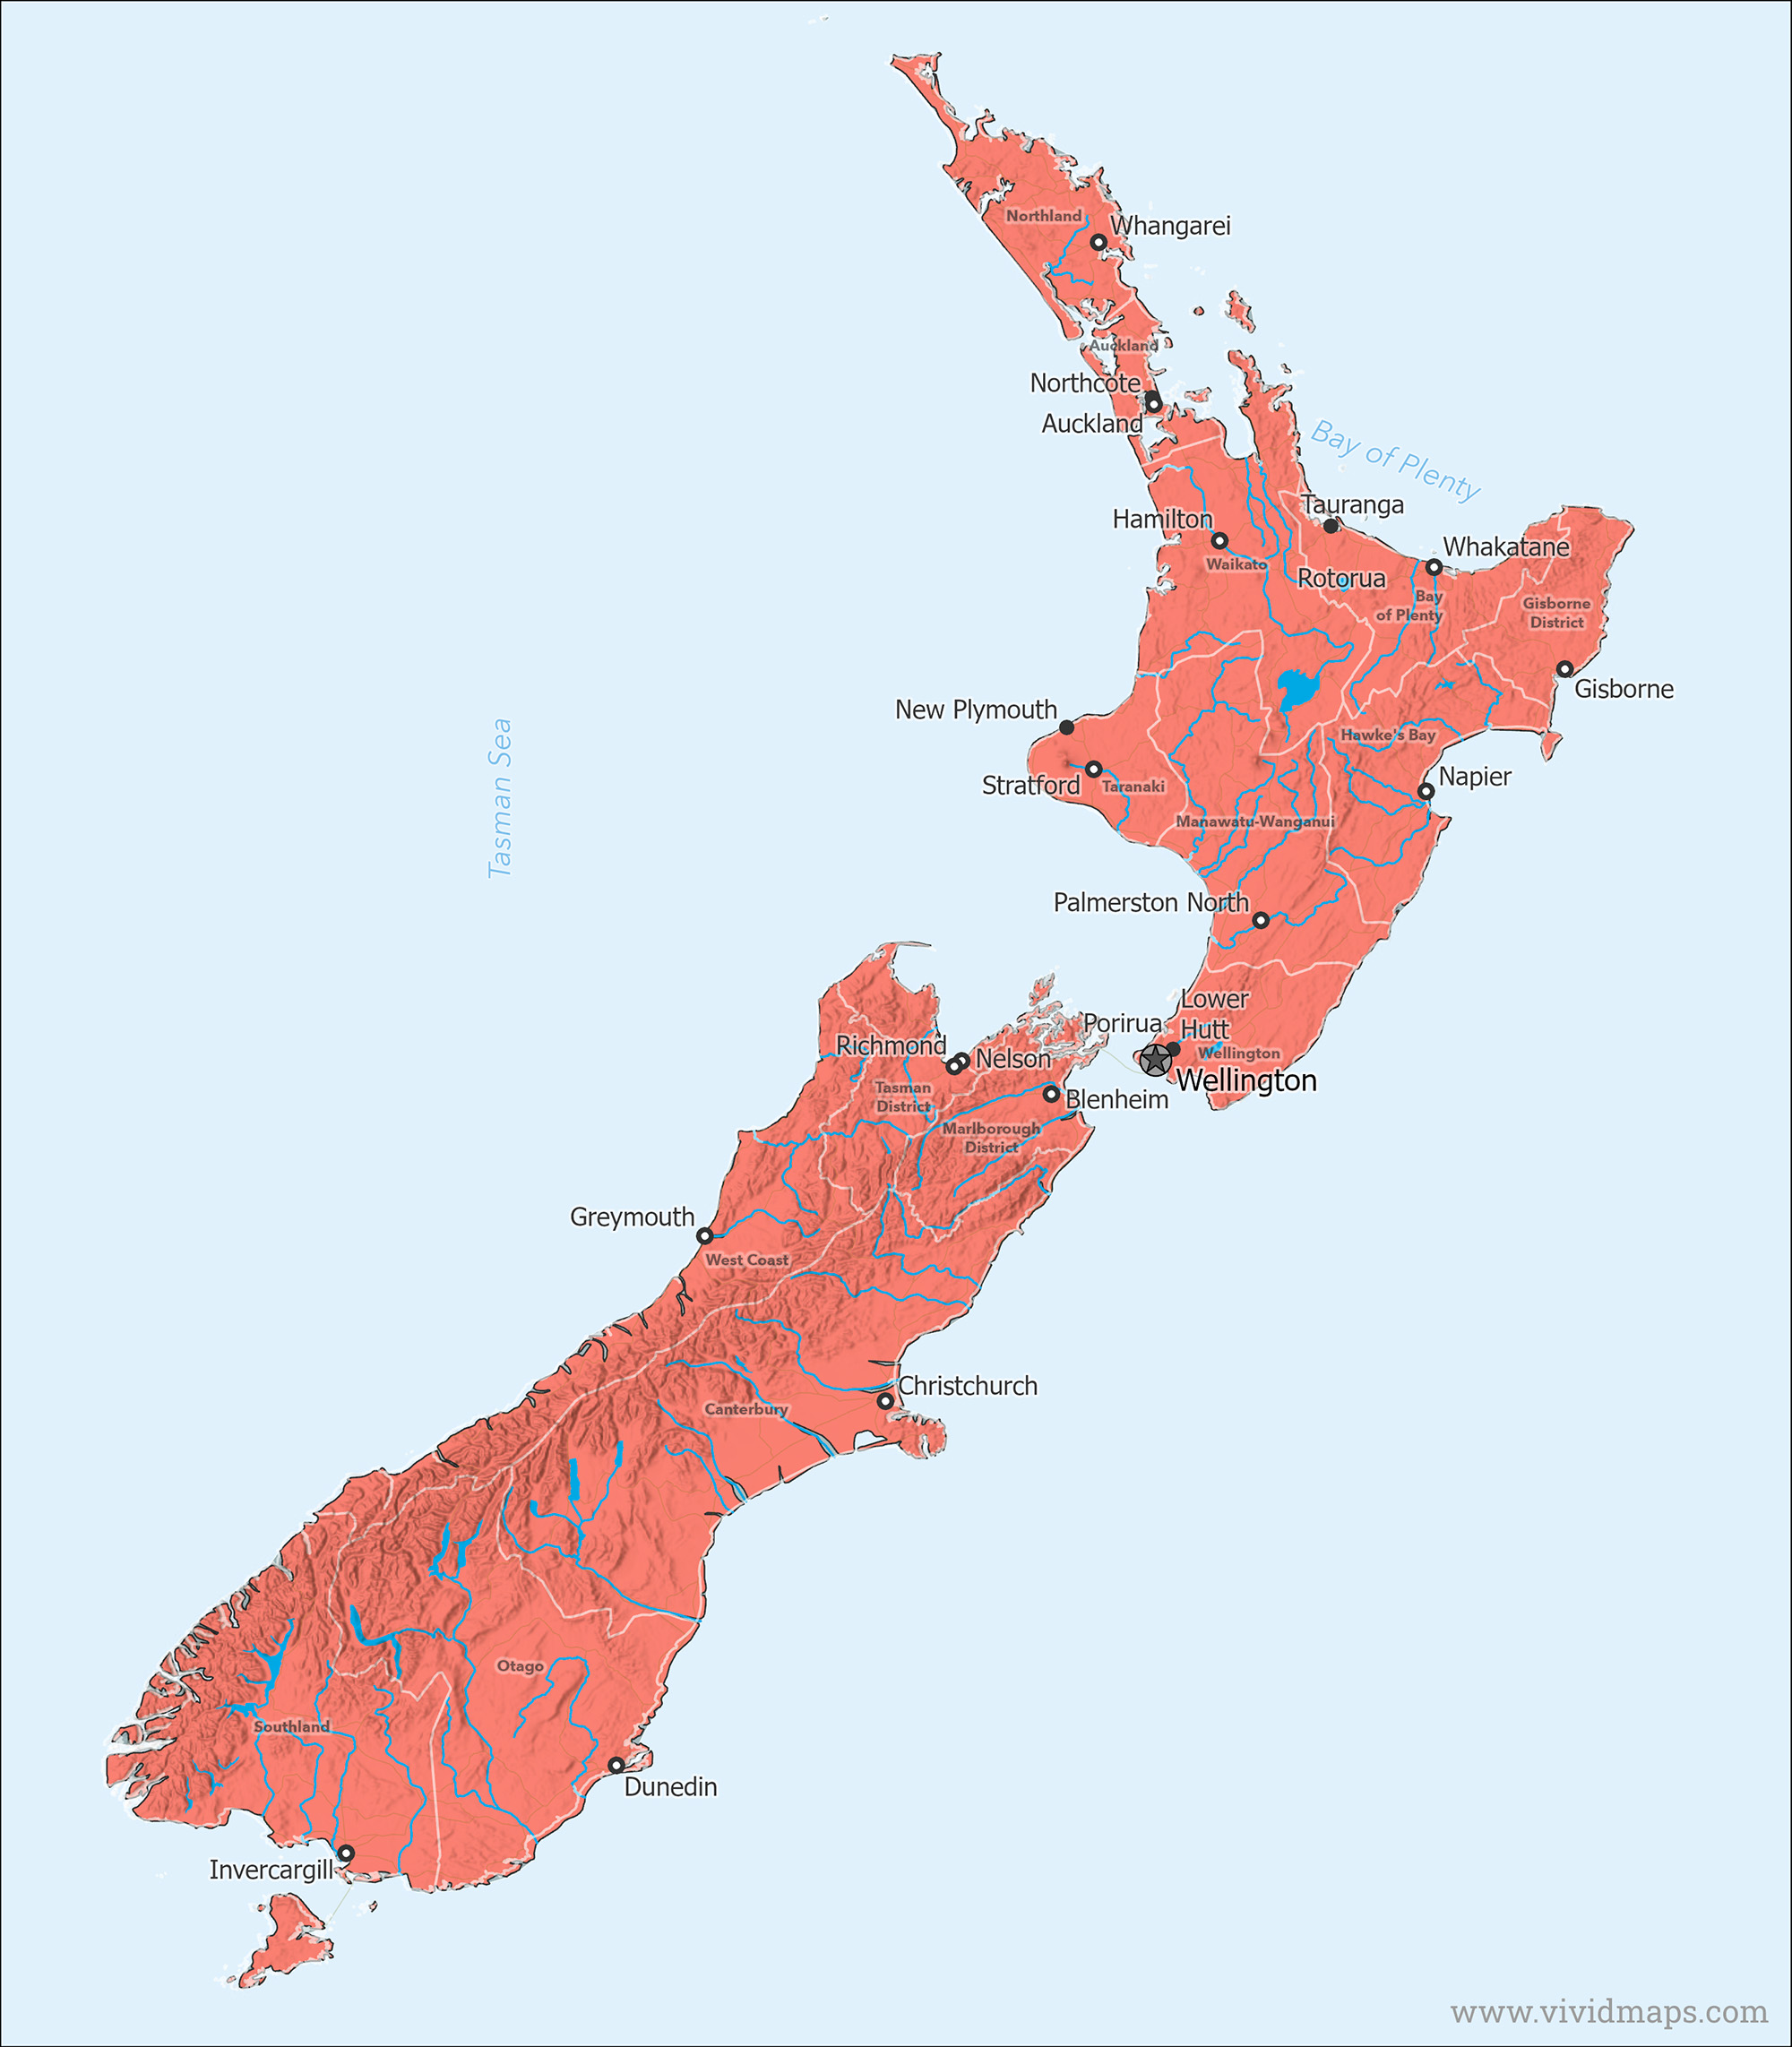
Map of New Zealand
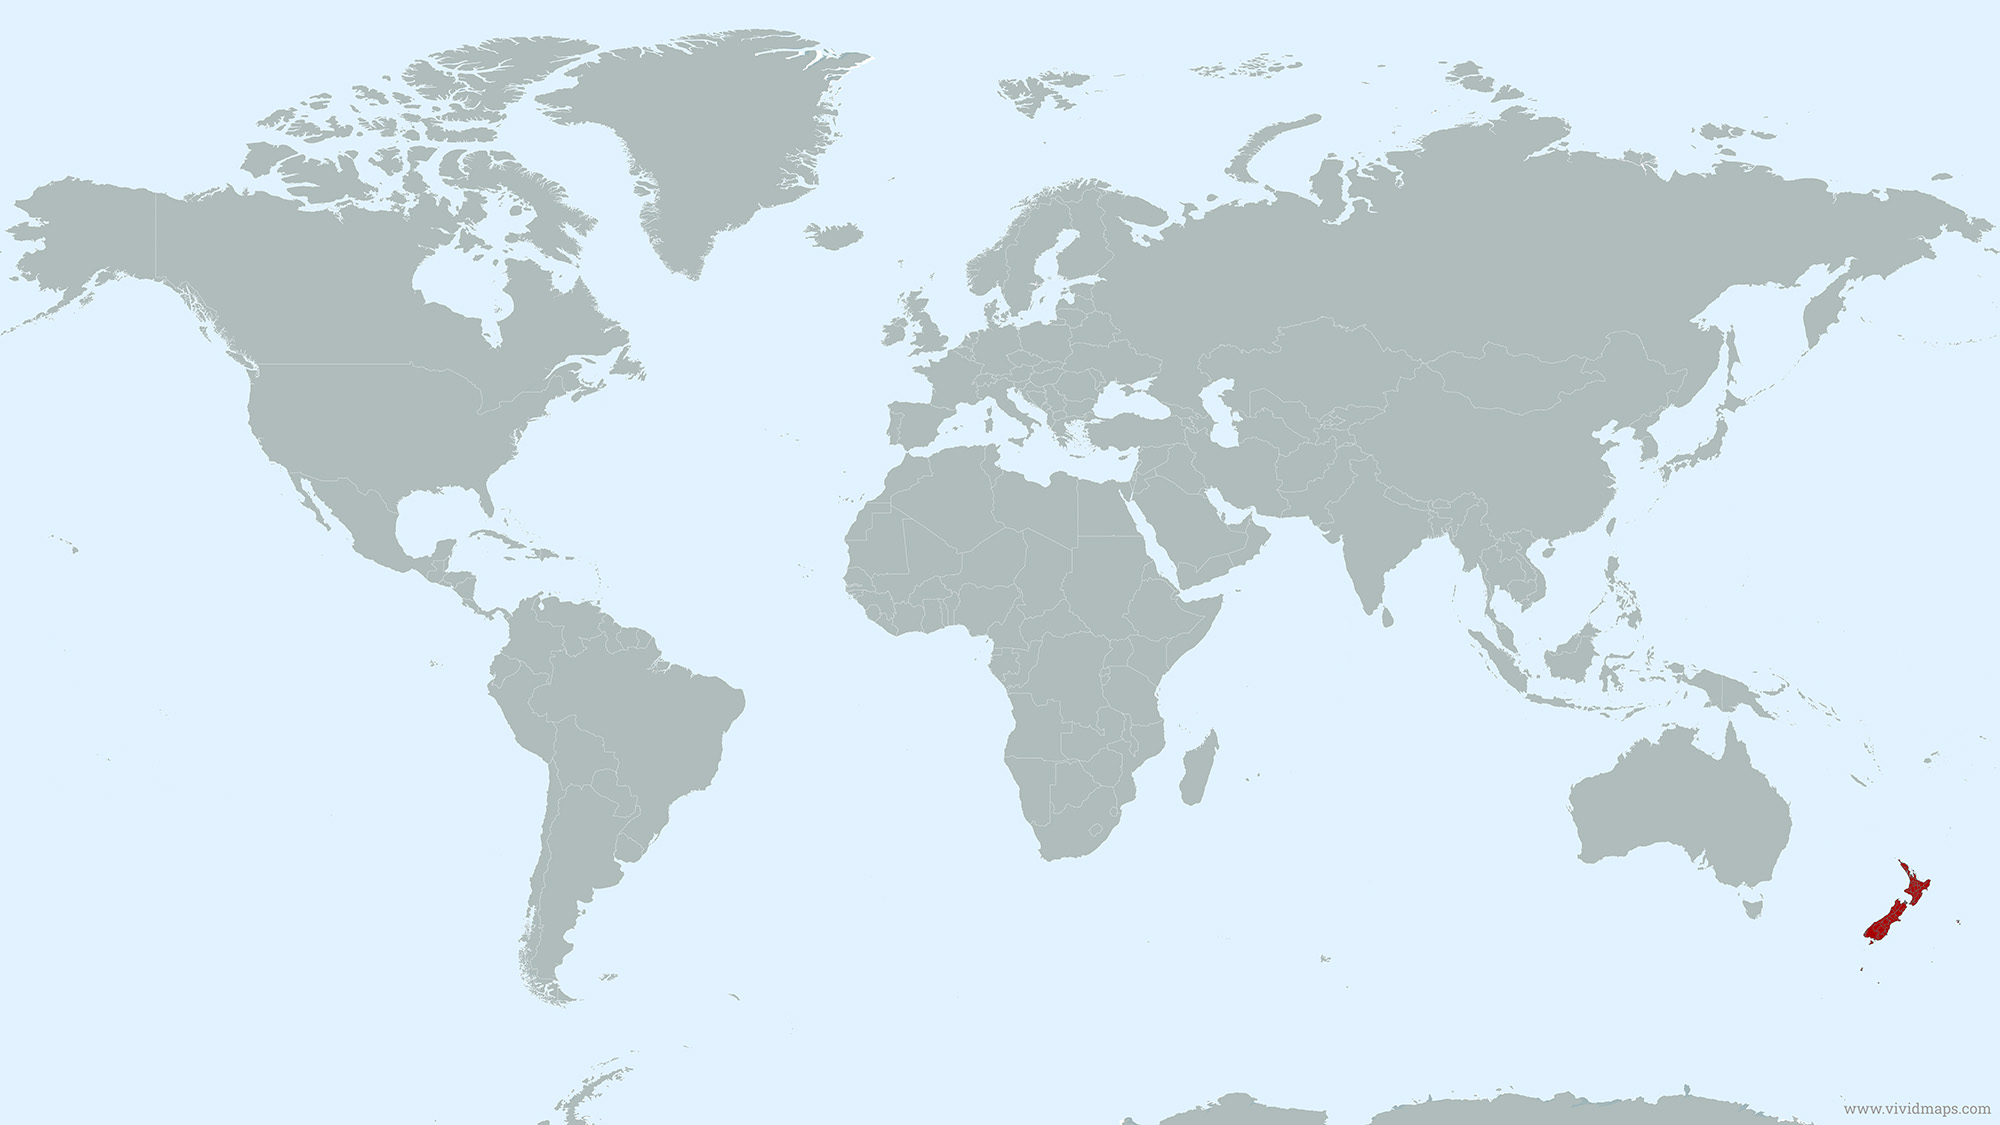
New Zealand Location Map
New Zealand Facts
Full Official Name: New Zealand
Demonym: New Zealander
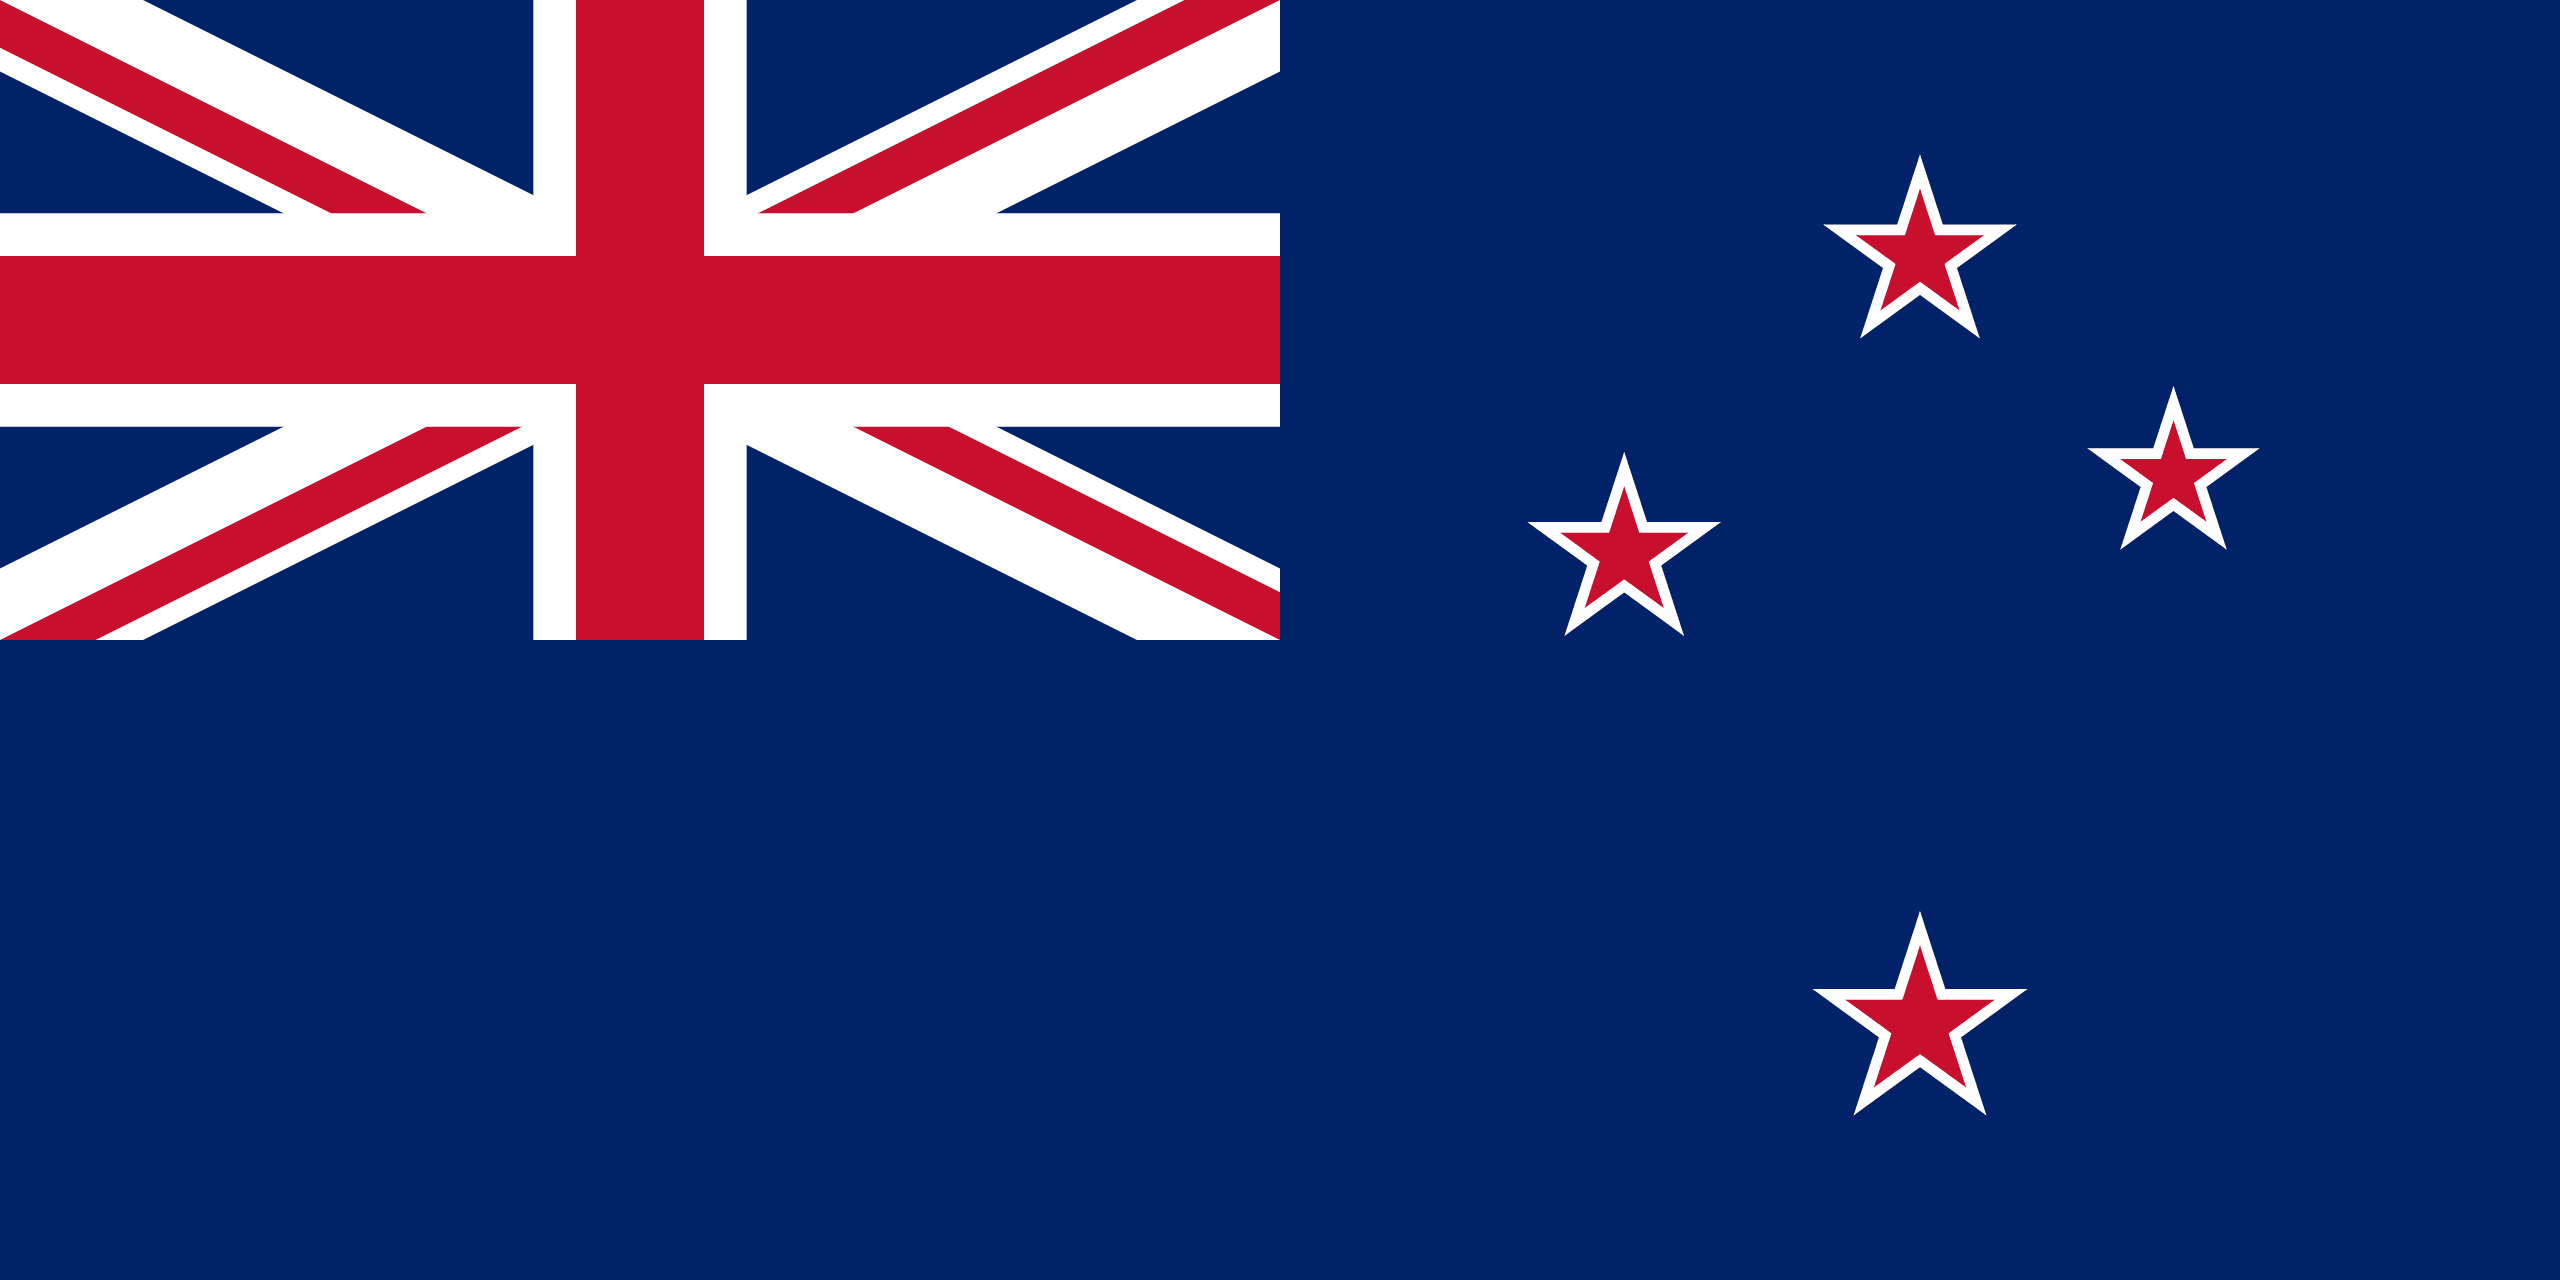
Flag:
Area
Total Area: 268,680 km² (103,740 mi²)
Land Area: (approx.) 97.9% land, 2.1% water.
Highest and Lowest Points
Highest Point: Aoraki / Mount Cook — 3,724 m (12,218 ft)
Lowest Point: Taieri Plain — approximately −2 m (−7 ft) below sea level
Demographics
Population: approx. 5.53 million (2025 est.)
Population Growth Rate: ~1.8% (2024 est.)
Largest City: Auckland — 1.53 million (2024)
Ethnic Groups: European 67.8%, Māori (19.6%), Asian (17.3%), Pacific peoples (8.9%), ME/LA/African (1.9%),
other 1.1% (2023).
Languages: English (de facto official) 95.4%, Maori (de jure official) 4%, Samoan 2.2%, Northern Chinese 2%, Hindi 1.5%, French 1.2%, Yue 1.1%, other or not stated 17.2% (2018 est.)
Religions: no religion 51.6%, Christianity 32.3%, Hinduism 2.9%, other 6.3%.
Economy
Currency: New Zealand Dollar (NZD)
Nominal GDP: ~US$249 billion (2025 est.)
GDP per Capita: ~US$55,450 (2025 est.)
Gini Index: 35% (2025)
Human Development Index (HDI): 0.938 (2023)
Exports: ~$61.799 billion (2024 est.)
Main Export Partners: China 28%, USA 12%, Australia 12%, Japan 6%, S. Korea 3% (2023)
Imports: $67.998 billion (2024 est.)
Main Import Partners: China 20%, Australia 11%, USA 9%, S. Korea 7%, Japan 7% (2023)
Government
Type: Unitary parliamentary constitutional monarchy
Capital City: Wellington
Other Facts
Time Zone: UTC +12 (Standard), UTC +13 (Daylight Saving)
Country Code: NZ
Internet TLD: .nz
Dialing code: +64
Climate Map of New Zealand
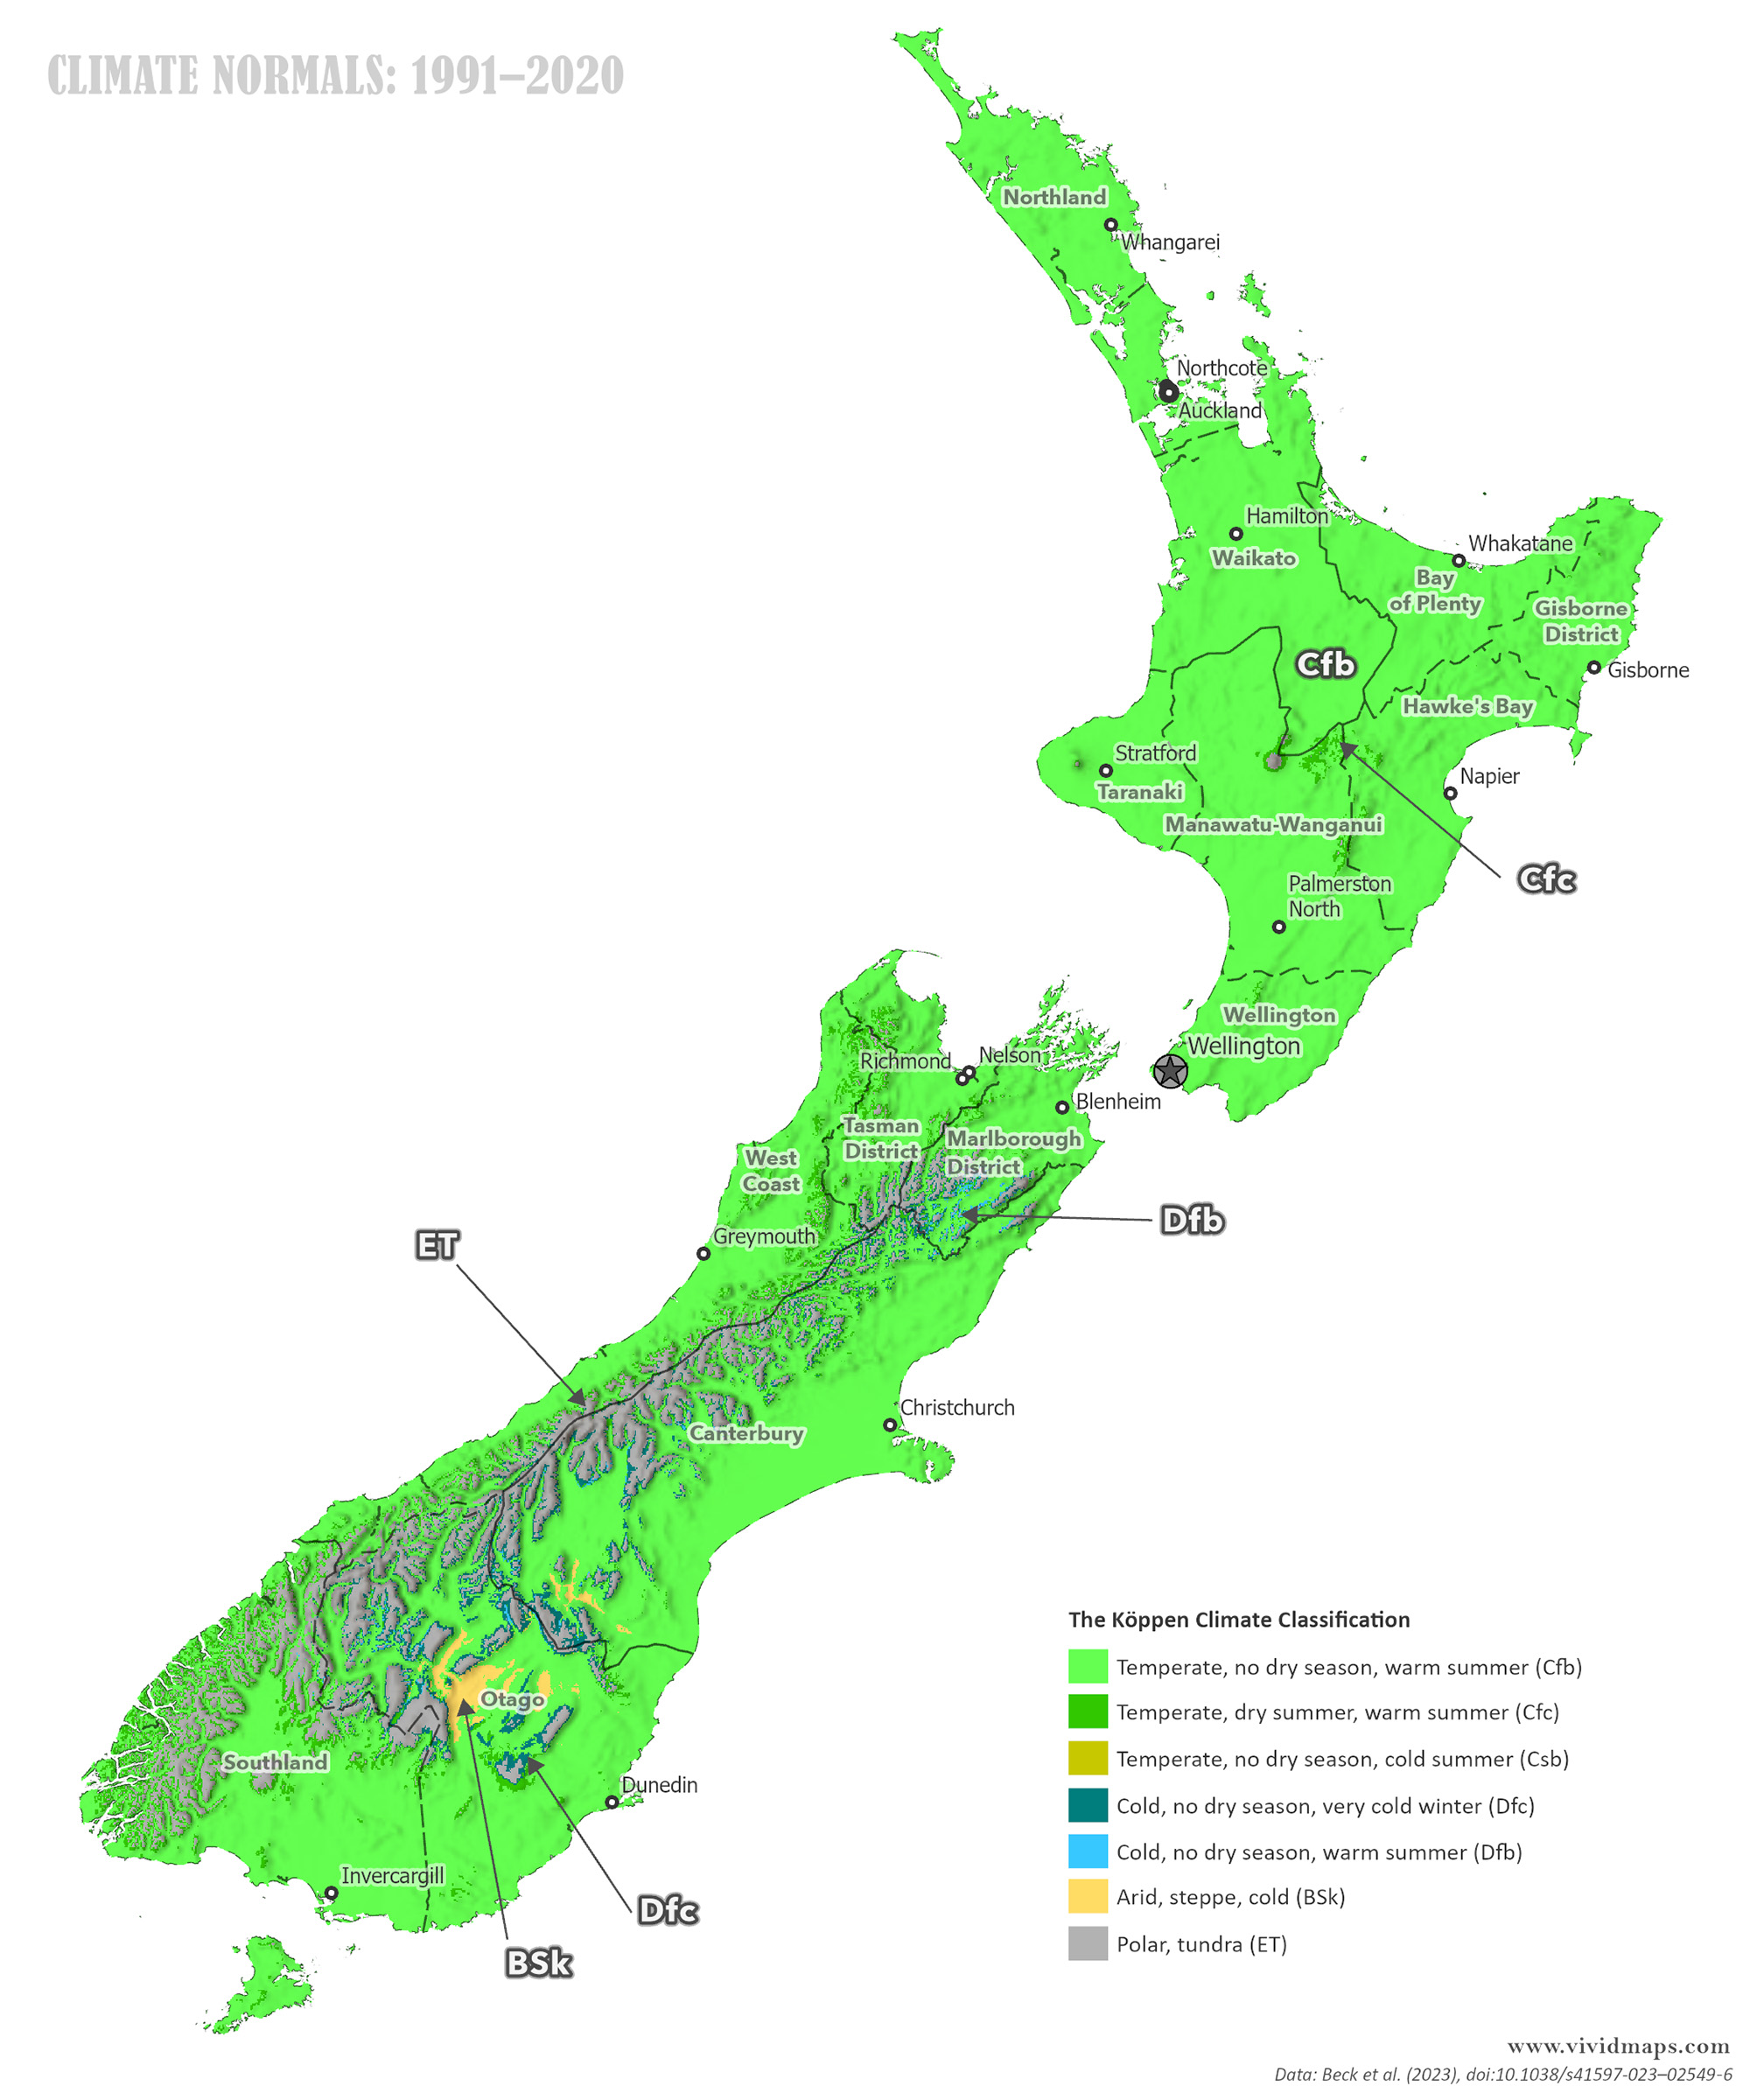
New Zealand’s climate is predominantly temperate maritime (Köppen Cfb), with variations from subtropical in the far north to near-alpine and sub-antarctic in some inland and southern regions. To find out how New Zealand’s climate may change in the future, see here.
Climate of Major Cities (1991–2020 normals)
Average Daily Mean Temperature — °C (°F)
| City | Jan | Feb | Mar | Apr | May | Jun | Jul | Aug | Sep | Oct | Nov | Dec | Year | Köppen |
|---|---|---|---|---|---|---|---|---|---|---|---|---|---|---|
| Auckland | 23.9 (75.0) | 23.0 (73.4) | 21.0 (69.8) | 17.9 (64.2) | 15.4 (59.7) | 13.2 (55.8) | 12.8 (55.0) | 14.0 (57.2) | 15.9 (60.6) | 17.9 (64.2) | 20.1 (68.2) | 22.3 (72.1) | 17.9 (64.2) | Cfb |
| Christchurch | 22.5 (72.5) | 20.5 (68.9) | 17.6 (63.7) | 13.0 (55.4) | 10.0 (50.0) | 8.2 (46.8) | 7.0 (44.6) | 7.8 (46.0) | 10.0 (50.0) | 12.8 (55.0) | 16.5 (61.7) | 19.6 (67.3) | 13.6 (56.5) | Cfb |
| Wellington | 20.3 (68.5) | 19.7 (67.5) | 17.3 (63.1) | 14.1 (57.4) | 11.4 (52.5) | 9.0 (48.2) | 8.5 (47.3) | 9.4 (48.9) | 11.6 (52.9) | 14.3 (57.7) | 16.6 (61.9) | 18.8 (65.8) | 13.2 (55.8) | Cfb |
| Hamilton | 24.6 (76.3) | 23.3 (73.9) | 21.0 (69.8) | 17.0 (62.6) | 14.1 (57.4) | 12.0 (53.6) | 11.6 (52.9) | 12.5 (54.5) | 14.5 (58.1) | 16.7 (62.1) | 19.0 (66.2) | 21.8 (71.2) | 15.3 (59.5) | Cfb |
| Tauranga | 24.3 (75.7) | 23.5 (74.3) | 21.4 (70.5) | 17.9 (64.2) | 15.0 (59.0) | 12.9 (55.2) | 12.4 (54.3) | 13.4 (56.1) | 15.1 (59.2) | 17.3 (63.1) | 19.4 (66.9) | 21.5 (70.7) | 15.7 (60.3) | Cfb |
Average Monthly Precipitation — mm
| City | Jan | Feb | Mar | Apr | May | Jun | Jul | Aug | Sep | Oct | Nov | Dec | Year | Köppen |
|---|---|---|---|---|---|---|---|---|---|---|---|---|---|---|
| Auckland | 101 | 101 | 95 | 89 | 92 | 110 | 100 | 95 | 90 | 100 | 110 | 105 | 1,188 | Cfb |
| Christchurch | 49 | 47 | 62 | 70 | 65 | 45 | 40 | 50 | 60 | 70 | 75 | 60 | 733 | Cfb |
| Wellington | 100 | 90 | 95 | 90 | 110 | 120 | 110 | 100 | 95 | 110 | 120 | 115 | 1,255 | Cfb |
| Hamilton | 120 | 110 | 105 | 90 | 95 | 100 | 95 | 90 | 85 | 100 | 110 | 105 | 1,115 | Cfb |
| Tauranga | 130 | 120 | 110 | 90 | 85 | 80 | 75 | 80 | 90 | 95 | 100 | 110 | 1,165 | Cfb |