Economic inequality comes in many forms, but two of the most commonly measured are income inequality and wealth inequality. While income refers to what individuals earn through wages, salaries, or business profits – wealth goes further. It encompasses income along with assets such as real estate, bank savings, investments, art collections, yachts, and gold bars.
In many countries, especially those experiencing rapid growth or deep structural divisions, wealth inequality is a more telling indicator of unequal living standards than income alone. Why? Because it reveals how assets are concentrated in the hands of a few or more evenly distributed among the population.
The Bottom 80% vs. the Wealthiest
Reddit user rubenbmathisen made fascinating maps of the global wealth inequality in 2021, visualized by comparing the bottom 80% with increasingly smaller groups at the top of the distribution.
These world maps show just how sharply tilted the balance is in many countries. In some countries, the wealth of the richest 0.01% exceeds what’s owned by the vast majority of the country’s entire population.
How Much Wealth Does the Bottom 80% Own?
Let’s flip the lens and focus solely on the bottom 80% of the population, often considered the majority working and middle class. How much wealth do they control in different parts of the world?
In many countries, especially in the Global South, the bottom 80% own only a modest slice of the national pie. In others — especially in parts of Europe — their share is relatively more balanced, though still far from equal.
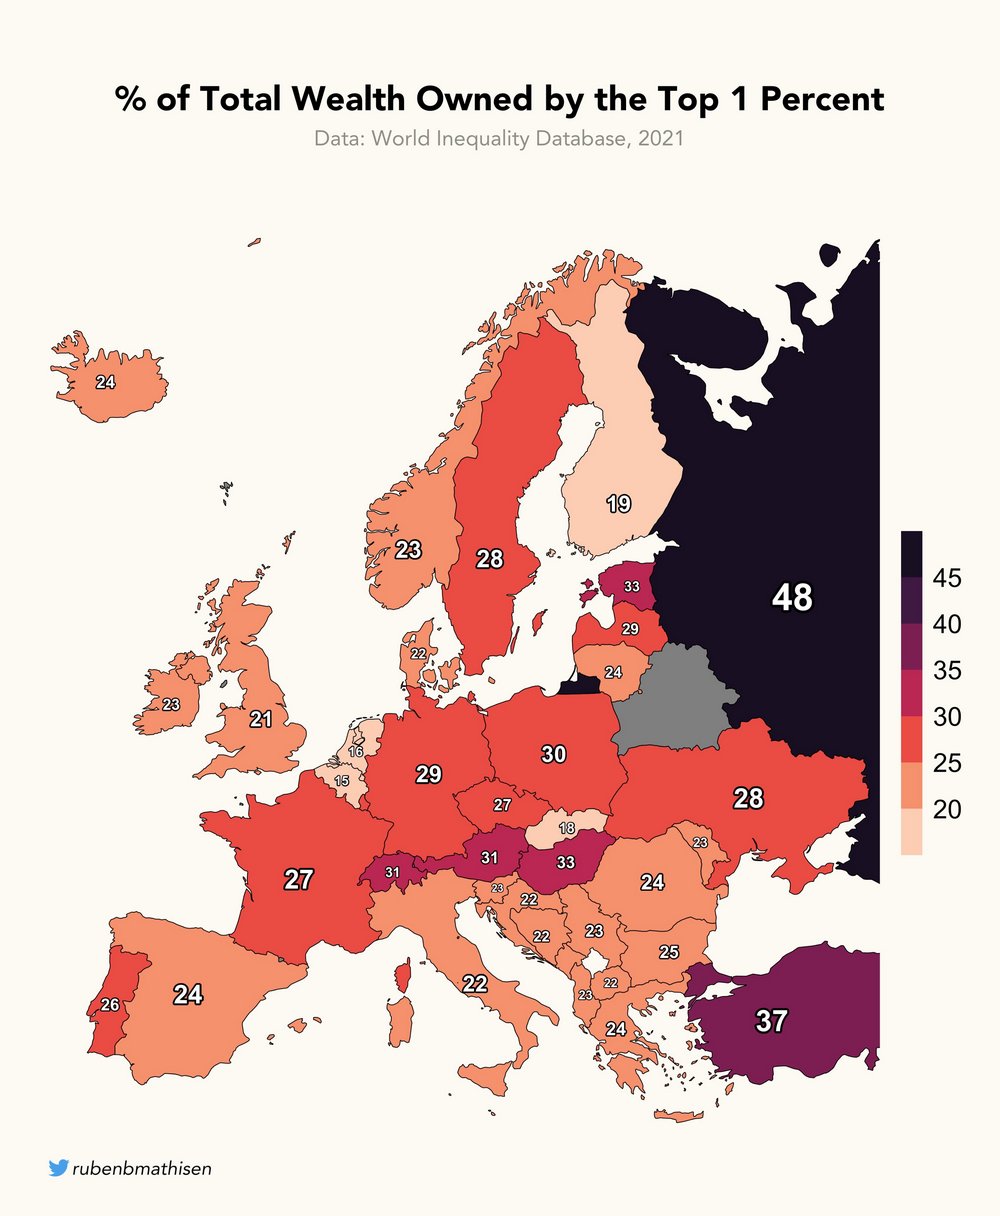
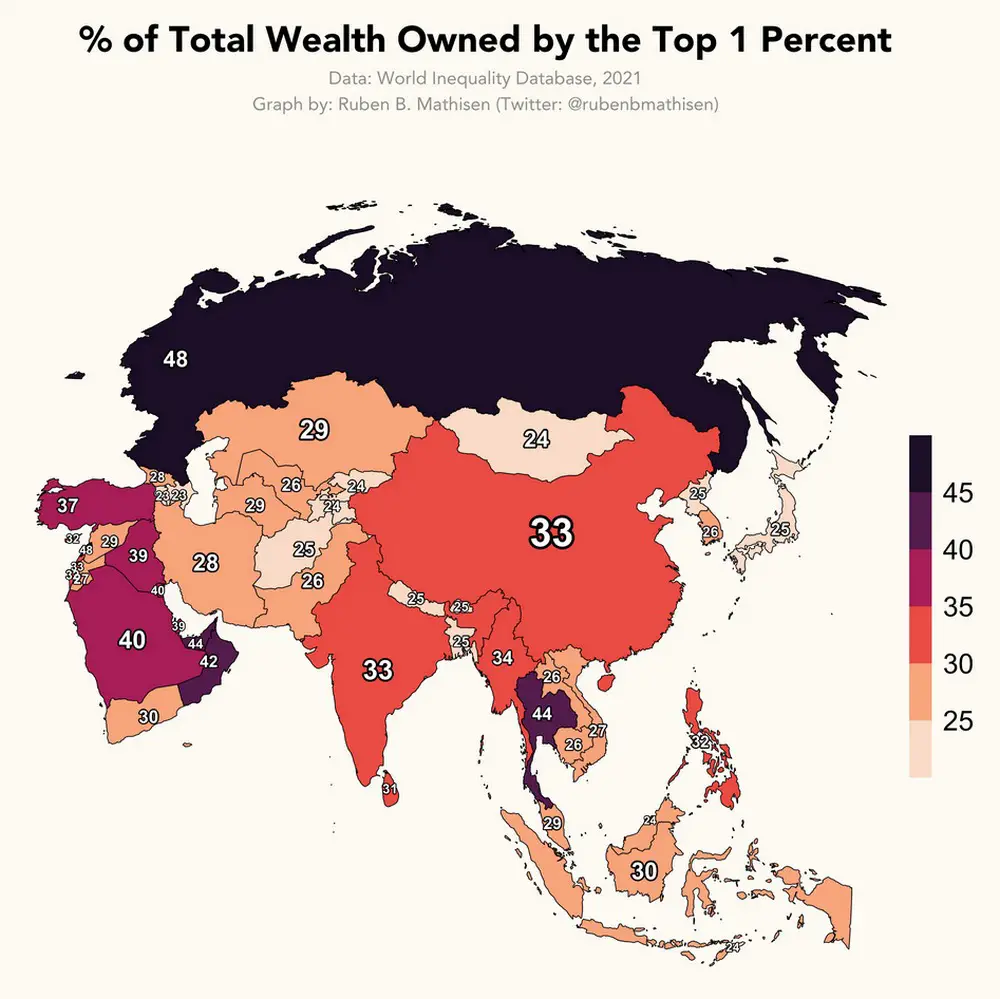
Top 1% Wealth Holders Around the World
So, what about the top 1%? These individuals typically include multimillionaires, billionaires, and highly affluent elites. Their grip on national wealth can be astonishing.
Here are the countries where the top 1% owns the highest percentage of national wealth:
Europe: Russia – 48%
Americas: Chile – 49%
Africa: South Africa – 55%
Asia: Lebanon – 48%
These maps show how even economically diverse regions like Asia or Latin America can exhibit similar inequality patterns among countries.
Globalization’s Double-Edged Sword
Interestingly, while global inequality between countries has typically decreased in the past few decades, thanks in part to globalization and development, inequality within countries has grown. In other words, although the average person in Vietnam or Nigeria may be better off than a generation ago, the gap between the poorest and the richest within their country has increased.
This pattern isn’t limited to developing countries. Even in some of the richest nations, like the United States, wealth inequality is alarmingly high.
The Gini Index: Measuring the Gap
To quantify inequality, economists often use the Gini coefficient (index), developed by Italian statistician Corrado Gini. It’s a number between 0 and 1:
0 means perfect equality — everyone has the same income or wealth
1 means total inequality — one person holds everything, and everyone else has nothing
Many countries fall somewhere in between. But some lean dangerously close to the high end of the scale.
Below are the lists of the countries with the highest and lowest wealth inequality according to the World Bank.
Top 10 Countries with the Lowest Wealth Inequality
Rank
Country
Gini Index, %
1
Slovenia
24.6
2
Czech Republic
25.0
3
Slovakia
25.0
4
Belarus
25.3
5
Moldova
25.7
6
United Arab Emirates
26.0
7
Iceland
26.1
8
Azerbaijan
26.6
9
Ukraine
26.6
10
Belgium
27.2
These countries tend to have strong social safety nets, accessible education, and progressive tax policies that redistribute wealth more evenly.
Top 10 Countries with the Highest Wealth Inequality
Rank
Country
Gini Index, %
1
South Africa
63.0
2
Namibia
59.1
3
Suriname
57.9
4
Zambia
57.1
5
Sao Tome and Principe
56.3
6
Central African Republic
56.2
7
Eswatini
54.6
8
Mozambique
54.0
9
Brazil
53.4
10
Botswana
53.3
In these nations, a small elite controls vast portions of the economy, often due to historic legacies of colonialism, corruption, or resource-based wealth without broad redistribution.
After looking at these maps, one can’t help but wonder: What kind of world do we want to live in — and how can we design economies that serve the many, not just the few?


Came here looking for copper but found gold
Equal Wealth Distribution Globally and Locally