
Cars
Road fatalities per 100,000 motor vehicles
Over the past 60 years, the number of road deaths in developed countries has declined significantly. In most developed countries, every 100,000 vehicles in 1950 were responsible for 100 deaths, but by 2010 they were responsible for only 5 deaths.
Read more: Road fatalities per 100,000 motor vehiclesMap of planned Tesla supercharger stations by end of 2016
Map of planned Tesla supercharger stations in USA by end of 2016 Map of planned Tesla supercharger stations in Europe
Read more: Map of planned Tesla supercharger stations by end of 2016Road accident map of India
In 2015 465 thousand accidents caused 149 thousand traffic-related deaths were reported in India. The 3 highest total amount of
Read more: Road accident map of IndiaTraffic deaths per 100,000
The 15 safest and 15 most dangerous nations are called out on the maps. Fatality rates per 100,000 people. At
Read more: Traffic deaths per 100,000Roads of Europe
The density of the road network is closely correlated with population density and, thus, with the degree of urbanization. The
Read more: Roads of EuropeRoad fatalities per 100,000 inhabitants per year
Road traffic injuries caused an estimated 1.25 million deaths worldwide. That is, one person is killed every 25 seconds. Only
Read more: Road fatalities per 100,000 inhabitants per year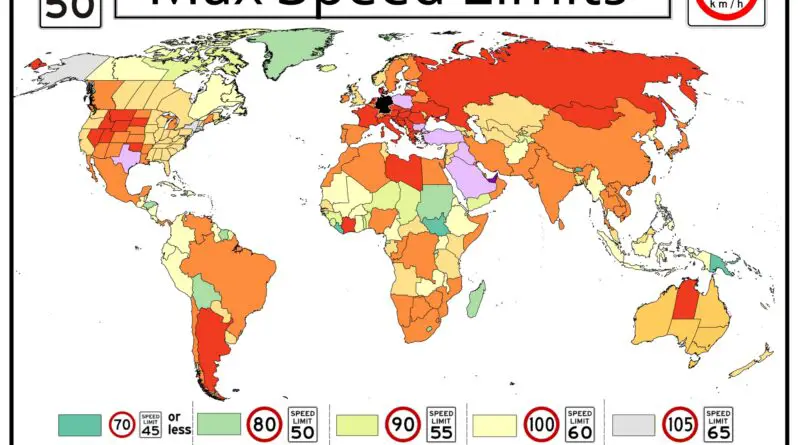
Maximum speed limits around the World
Speed limits vary around the world and are typically set by individual countries or regions within a country. These limits are established to promote road safety and reduce the risk of accidents.
Read more: Maximum speed limits around the World