Retirement should be a time of peace and possibility. Yet for millions of American women, it’s becoming a financial minefield. As NetCredit reports, nearly 4.1 million Americans are preparing to retire this year, revealing a critical story of systemic challenges that threaten especially women’s financial futures.
The Silent Financial Struggle
Behind the statistics lies a deeply personal narrative of economic inequality. Women aren’t just earning less—they’re facing a complex web of financial challenges that compound over decades. The gender pay gap isn’t just about current earnings; it’s a lifelong journey that dramatically impacts retirement security.
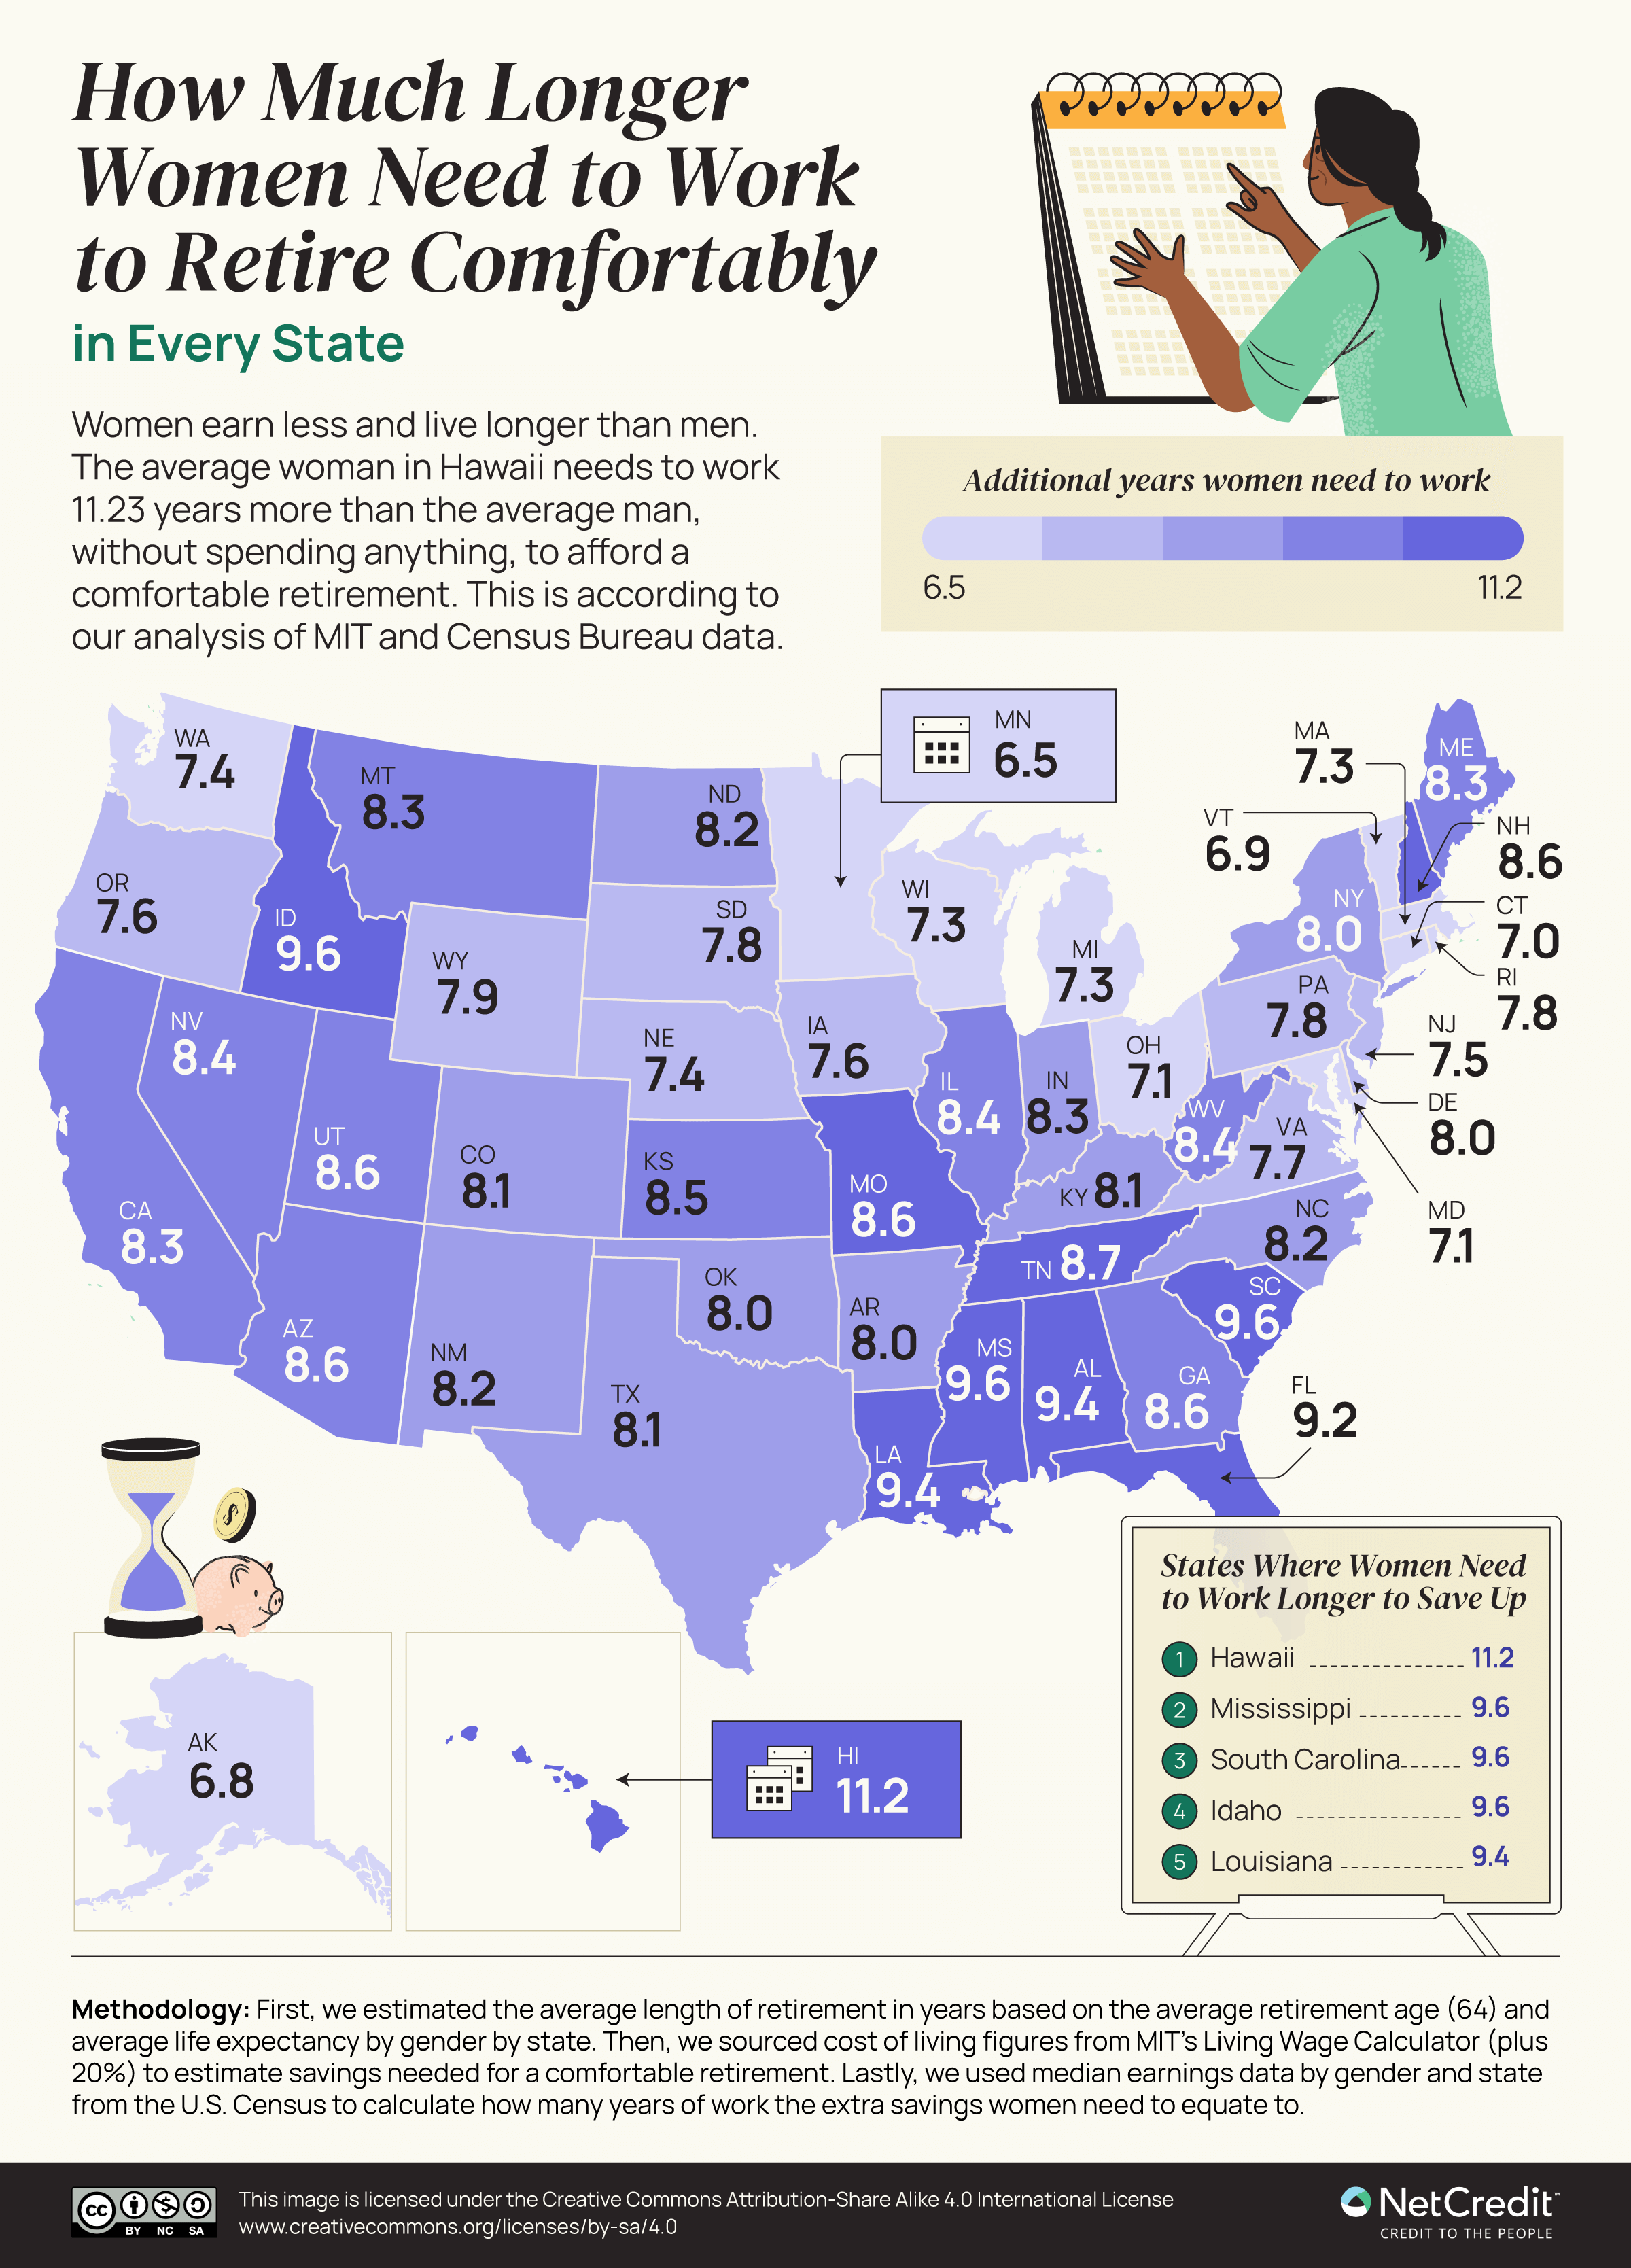
Consider the harsh realities: Women earn just 84% of what men earn, live six years longer, and are statistically more likely to interrupt their careers for caregiving. These aren’t just numbers—they’re real-life constraints that reshape financial trajectories.
Hawaii: The Retirement Savings Battleground
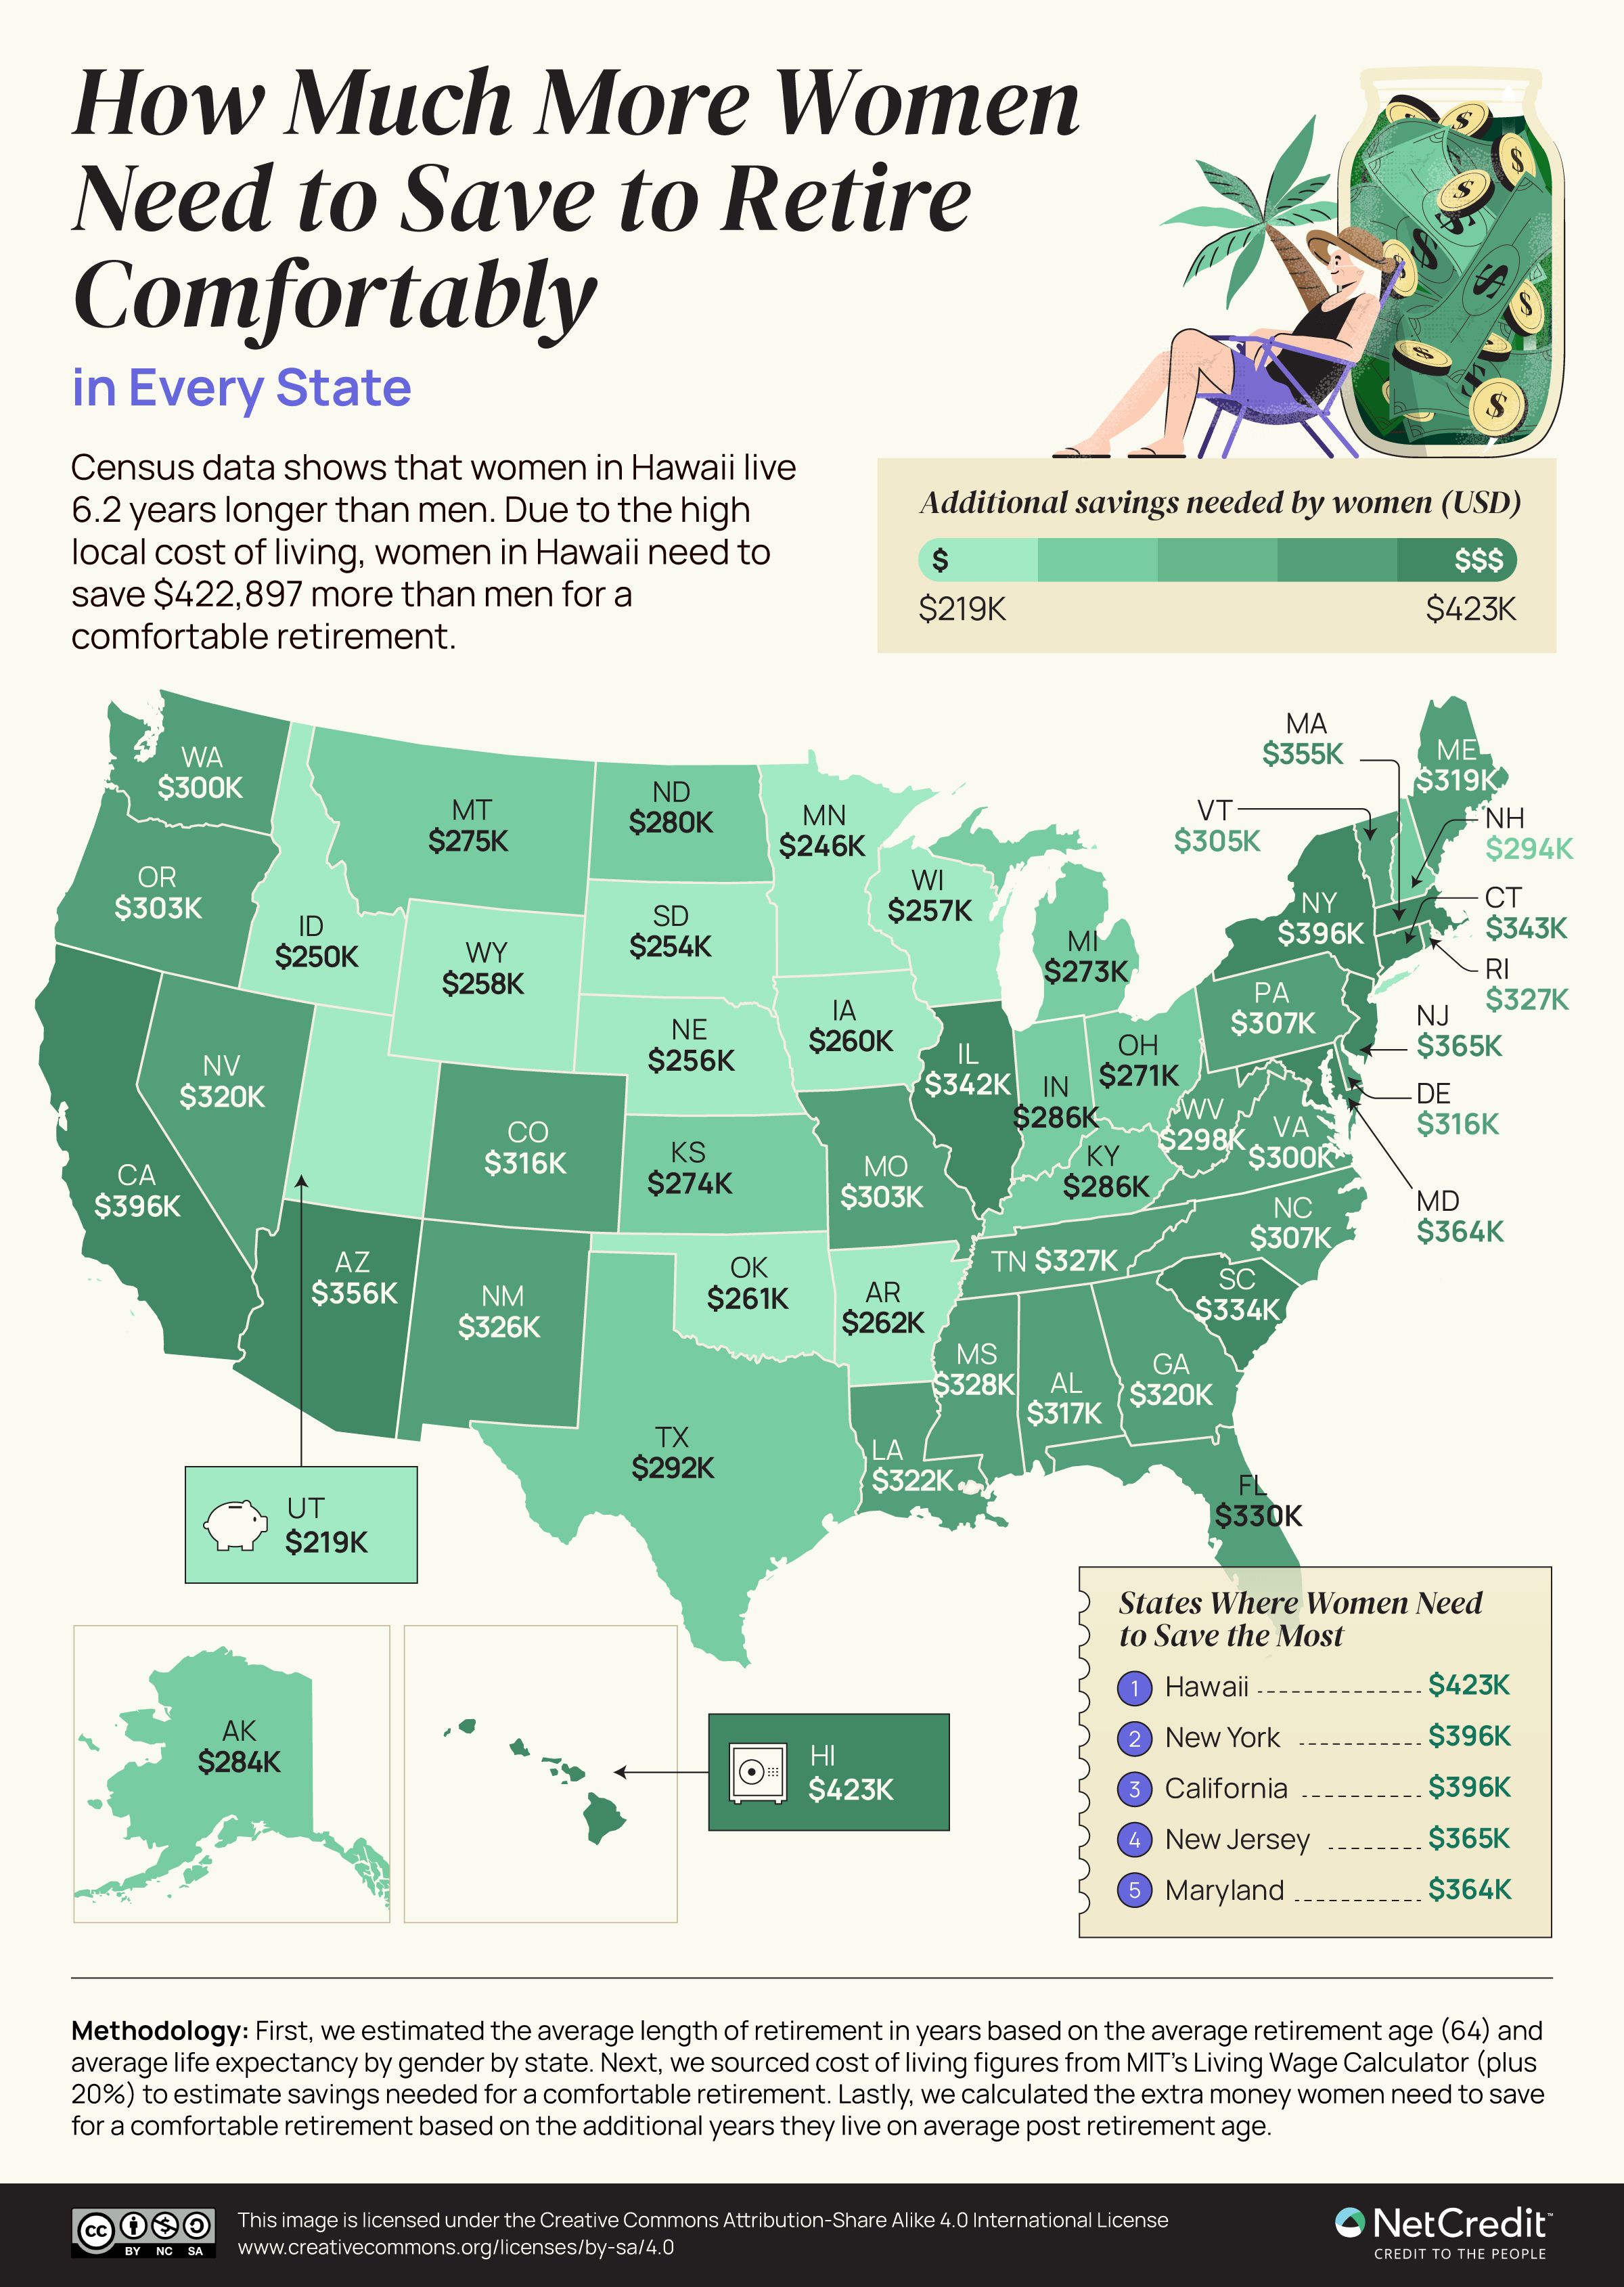
If retirement savings challenges had a poster child, it would be Hawaii. The state represents an extreme example of the broader national issue. Women in Hawaii need to save a staggering $1,350,542 for a comfortable retirement—the highest in the United States.
Hawaii’s unique demographic landscape creates perfect conditions for retirement complexity. Women here live an average of 19.8 years past retirement age, facing living costs of $68,209 annually. More critically, older women in Hawaii are more likely to be single, meaning they shoulder housing and living expenses alone. Approximately 13% of single older women in Hawaii live in poverty, compared to just 4.1% of married women.
The numbers tell a stark story: Women in Hawaii must work 11.23 years longer than men to reach their retirement savings goals. This isn’t just a statistic—it’s a testament to systemic economic challenges.
The Southeastern Retirement Dilemma
While Hawaii represents an extreme, the Southeastern United States presents its own retirement savings challenges. In states like Mississippi and South Carolina, women face nearly identical hurdles, needing to work approximately 9.63 years longer than men to build adequate retirement funds.
This isn’t a coincidence. Mississippi, which only enacted its equal pay law in 2022, symbolizes the ongoing struggle for workplace equity. These additional working years aren’t just time—they represent lost opportunities, delayed dreams, and continued economic pressure.
New York’s Complex Financial Landscape
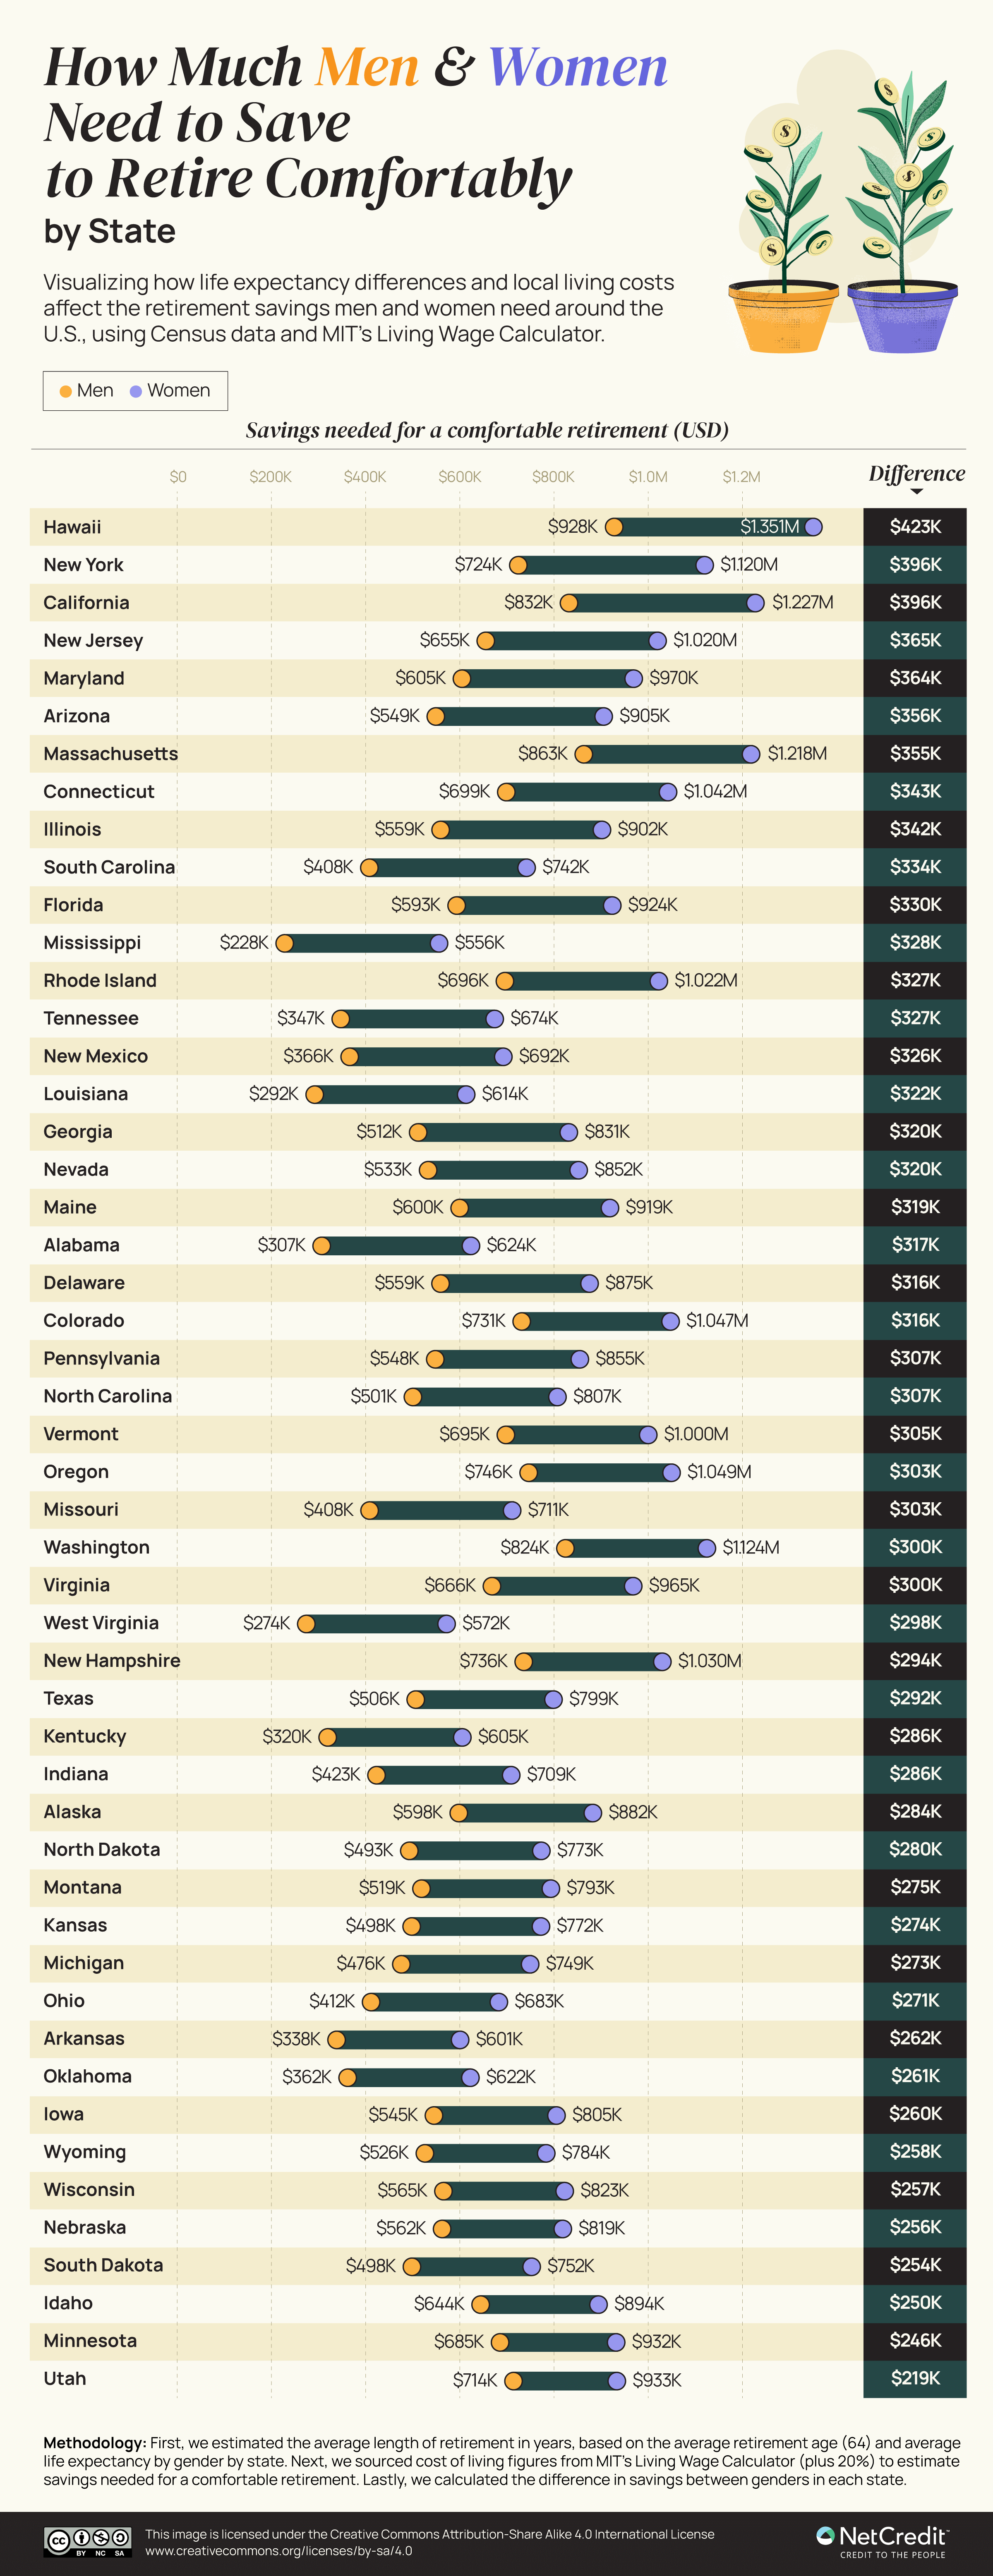
New York offers another fascinating case study. Despite being a hub of economic opportunity, the state reveals deep-rooted financial inequalities. Women in New York need to save $1,119,795 for retirement—a whopping $395,616 more than their male counterparts.
New York State Attorney General Letitia James captures the essence of this challenge: “Being paid less can weaken a woman’s ability to provide for herself or save for retirement… The pay gap is even worse for women of color”.
A Generational Financial Pressure Cooker
Millennials aren’t immune to these challenges. Carrying an average of $30,558 in non-mortgage debt and facing housing costs that outpace wage increases, younger women confront an even more complex financial future.
Income strategist Diane Garnick offers a powerful perspective: “People wouldn’t go through an entire year without a physician’s checkup. Similarly, we need annual financial check-ups to ensure we’re on the right track”.
State
Length for retirement for men (years)
Length for retirement for women (years)
Savings needed to retire comfortably for men
Savings needed to retire comfortably for women
Extra time women need to work to retire comfortably (yers)
Extra money women need to retire comfortably
Alabama
6.1
12.4
$306,789
$623,636
9.37
$316,847
Alaska
10.3
15.2
$597,915
$882,360
6.82
$284,445
Arizona
9.4
15.5
$549,077
$905,392
8.58
$356,316
Arkansas
7.1
12.6
$338,448
$600,627
7.99
$262,178
California
12.2
18
$831,918
$1,227,420
8.26
$395,502
Colorado
11.8
16.9
$731,279
$1,047,340
8.11
$316,061
Connecticut
11.6
17.3
$698,700
$1,042,027
7.02
$343,327
Delaware
9.9
15.5
$559,120
$875,390
7.95
$316,270
Florida
10.6
16.5
$593,324
$923,571
9.15
$330,247
Georgia
8.8
14.3
$511,611
$831,368
8.57
$319,757
Hawaii
13.6
19.8
$927,645
$1,350,542
11.23
$422,897
Idaho
12.1
16.8
$644,194
$894,419
9.56
$250,224
Illinois
9.8
15.8
$559,294
$901,719
8.44
$342,425
Indiana
8.3
13.9
$423,400
$709,067
8.26
$285,667
Iowa
10.9
16.1
$545,148
$805,219
7.59
$260,071
Kansas
9.8
15.2
$3497.883
$5772.227
8.52
$5274.344
Kentucky
6.6
12.5
$319,612
$605,325
8.09
$285,713
Louisiana
5.9
12.4
$291,930
$613,547
9.4
$321,617
Maine
10.9
16.7
$599,640
$918,714
8.3
$319,074
Maryland
9.8
15.7
$605,170
$969,506
7.12
$364,337
Massachusetts
12.4
17.5
$863,174
$1,218,189
7.33
$355,015
Michigan
9.4
14.8
$475,869
$749,241
7.3
$273,372
Minnesota
12
17.4
$605,455
$931,791
6.47
$246,336
Mississippi
4.6
11.2
$228,313
$555,892
9.63
$327,579
Missouri
8.1
14.1
$408,473
$711,046
8.62
$302,573
Montana
10.2
15.6
$518,658
$793,241
8.34
$274,584
Nebraska
11.2
16.3
$562,451
$818,566
7.41
$256,116
Nevada
9.5
15.2
$532,688
$852,300
8.35
$319,613
New Hampshire
12.5
17.5
$736,675
$1,029,945
8.62
$294,270
New Jersey
10.6
16.5
$655,131
$1,019,779
7.5
$364,648
New Mexico
7.3
13.8
$366,229
$692,324
8.24
$326,095
New York
10.8
16.7
$724,179
$1,119,795
7.97
$395,616
North Carolina
9.3
15
$500,504
$807,264
8.2
$306,760
North Dakota
10.2
16
$492,807
$773,030
8.15
$280,224
Ohio
8.5
14.1
$411,662
$682,874
7.13
$271,212
Oklahoma
7.5
12.9
$361,899
$622,466
7.97
$260,567
Oregon
12.3
17.3
$746,162
$1,049,480
7.61
$303,318
Pennsylvania
10
15.6
$547,932
$854,774
7.78
$306,842
Rhode Island
11.5
16.9
$695,768
$1,022,477
7.82
$326,709
South Carolina
7.7
14
$407,964
$741,754
9.63
$333,789
South Dakota
10.2
15.4
$498,388
$752,469
7.82
$254,080
Tennessee
6.7
13
$347,296
$673,858
8.66
$326,562
Texas
9.7
15.3
$506,433
$798,807
8.13
$292,374
Utah
12.7
16.6
$713,994
$933,252
8.58
$219,258
Vermont
12.1
17.4
$695,392
$999,985
6.89
$304,593
Virginia
11.1
16.1
$665,640
$965,478
7.67
$299,838
Washington
12.9
17.6
$824,186
$1,124,471
7.39
$300,285
West Virginia
5.8
12.1
$274,127
$571,885
8.44
$297,758
Wisconsin
11.2
16.3
$565,313
$822,733
7.34
$257,419
Wyoming
10
14.9
$525,876
$783,555
7.88
$257,679
Beyond the Numbers: Pathways to Financial Empowerment
The retirement savings gap is more than a statistical anomaly—it’s a systemic challenge that requires multi-dimensional solutions. Financial education, workplace policy reforms, and individual strategic planning can create meaningful change.
For women, this means:
Prioritizing consistent retirement contributions
Seeking professional financial advice
Negotiating salaries and understanding workplace value
Creating backup financial strategies
Supporting policies that address wage inequalities
Each strategy represents a step toward breaking the cycle of financial vulnerability and creating a more secure future.