Gerrymandering is a controversial political tactic that involves manipulating electoral district boundaries to give one party an advantage over another. The term originates from 1812 when Massachusetts Governor Elbridge Gerry approved a district shaped like a salamander—thus, the term “gerrymander” was born. Over two centuries later, gerrymandering remains a powerful and divisive force in American politics.
How Gerrymandering Works
There are two primary methods used in gerrymandering:
Cracking: This involves spreading voters of the opposing party across multiple districts to dilute their influence, ensuring they are unable to win a majority in any district.
Packing: This strategy concentrates voters of the opposing party into a single district, which allows the dominant party to win more districts with smaller margins.
This manipulation of district boundaries can create oddly shaped and highly partisan districts that defy geographic and demographic logic. The goal is not to represent voters fairly but to secure electoral outcomes favorable to the dominant party.
Gerrymandering in Action
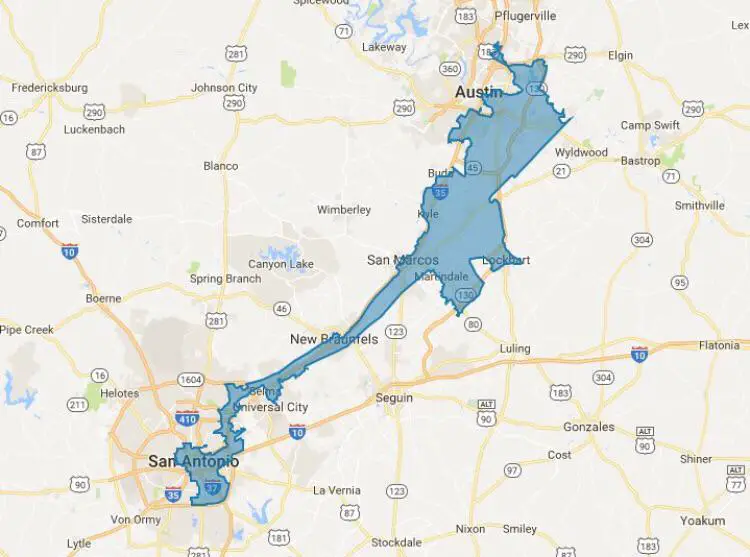
One of the most infamous examples of gerrymandering is in Texas, where districts have been drawn in a way that heavily favors one party. The map below shows the current congressional boundaries in Texas—notice the irregular shapes, which reflect deliberate attempts to consolidate or fragment voter influence.
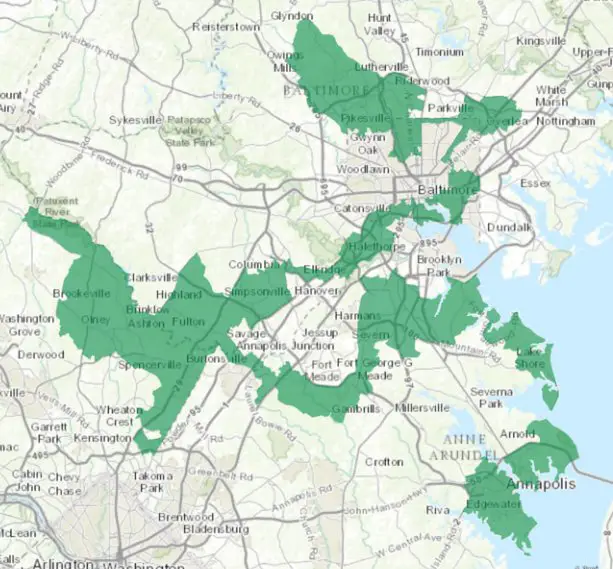
Another dramatic case is Maryland’s 3rd Congressional District. Nicknamed the “praying mantis” due to its bizarre shape, this district has been carefully drawn to maximize political advantage. Critics have argued that it undermines fair representation and skews election results.
Extreme Outcomes: The Gerrymandered States of America
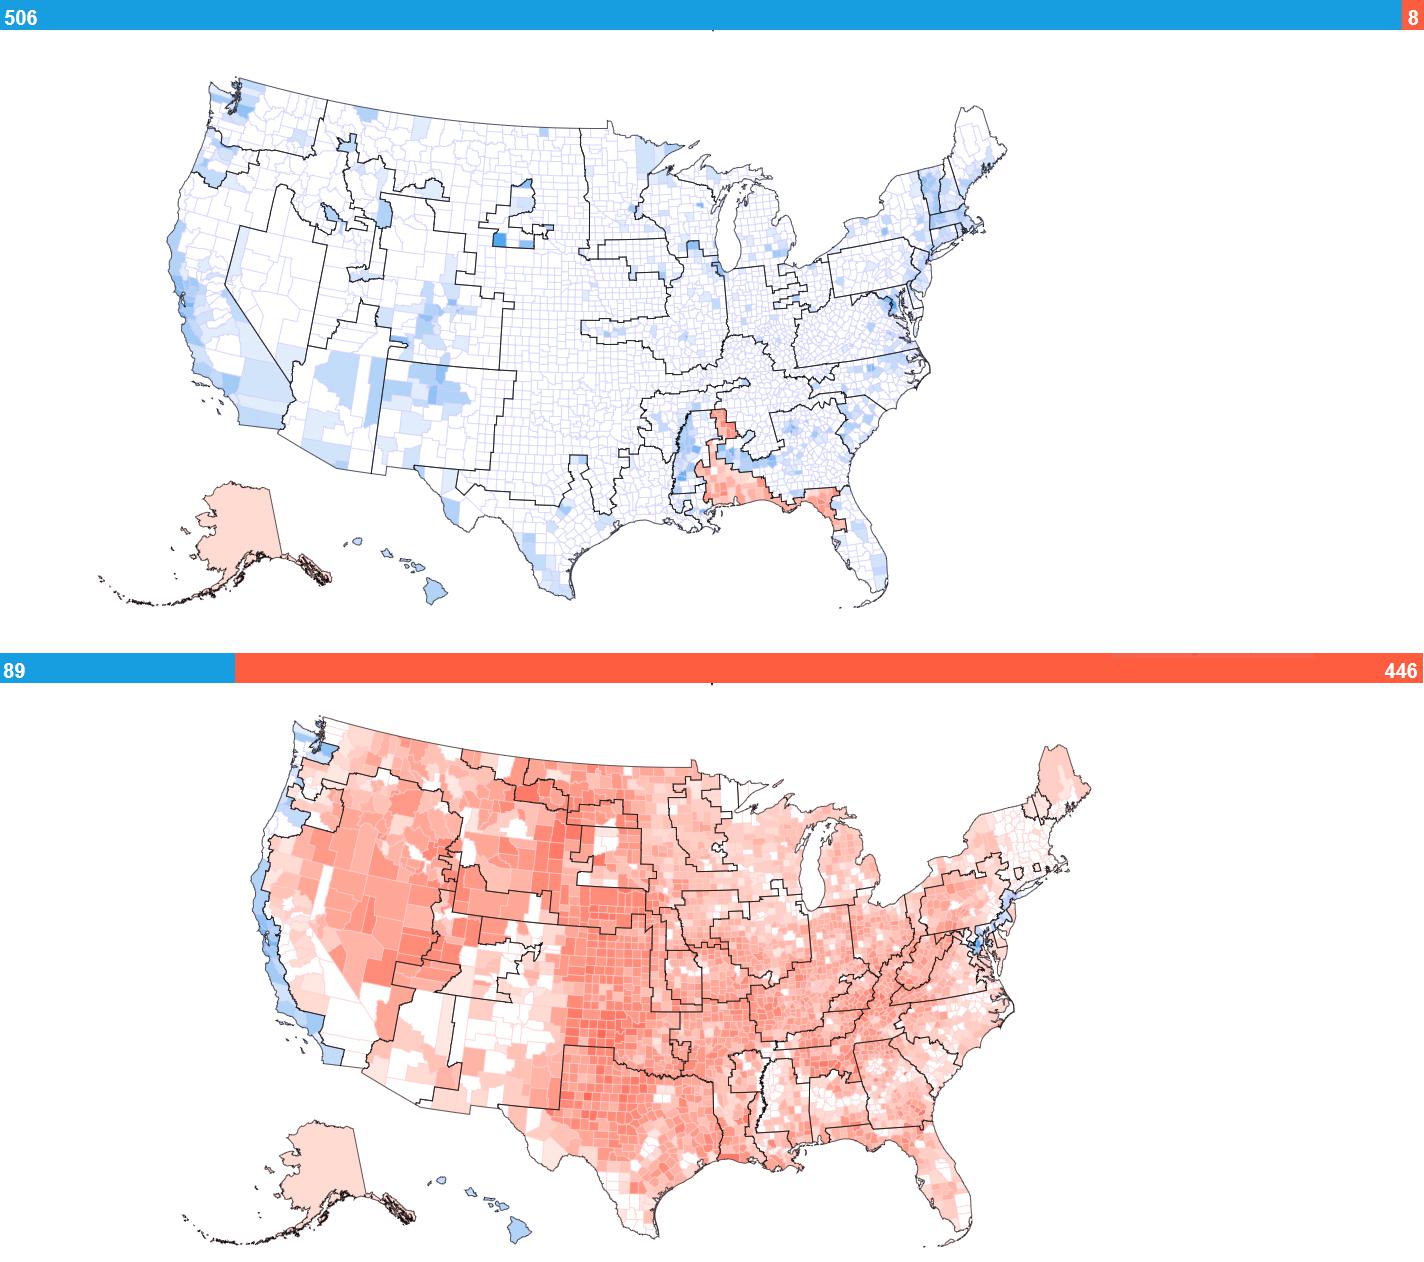
A Reddit user named Putin-is-listening created a pair of striking maps that illustrate how extreme gerrymandering could influence the outcome of a presidential election.
In the first map, Joe Biden wins 506 electoral votes while Donald Trump secures only 8—even though the popular vote remains unchanged.
In the second map, Trump wins with 446 electoral votes while Biden is left with only 89, despite the same popular vote count.
These maps highlight how manipulating district lines can create wildly different electoral outcomes without changing the actual votes cast.
Challenges and Solutions
Several mathematical and statistical tests have been developed to detect and challenge gerrymandering:
Efficiency Gap: This method measures “wasted votes”—votes that do not contribute to winning a district. A high-efficiency gap suggests that one party is benefiting unfairly from how the districts are drawn.
Partisan Bias Test: This test measures whether the share of seats won by a party is disproportionate to the share of the vote they received.
Compactness Tests: Districts that are excessively irregular in shape are often suspected of being gerrymandered.
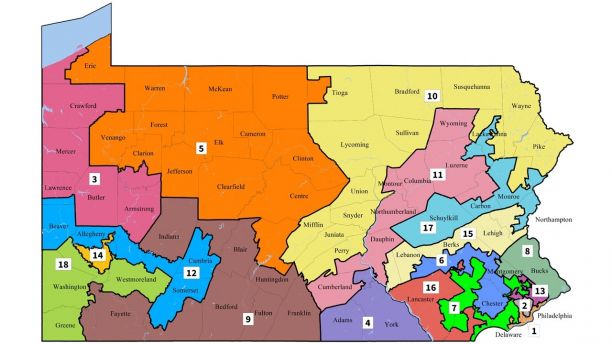
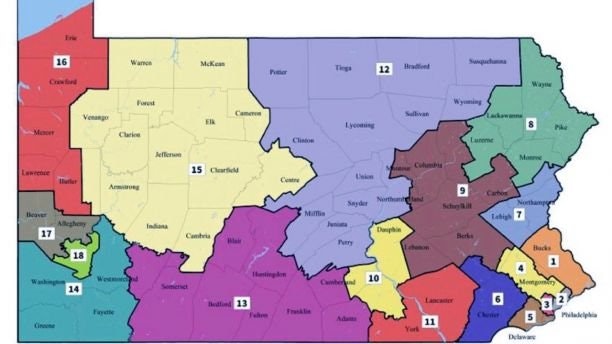
A notable example of successful anti-gerrymandering efforts occurred in Pennsylvania. The state’s congressional map was challenged in court, and in 2018, the Pennsylvania Supreme Court imposed a new map that corrected the partisan imbalance. The difference is clear when comparing the old and new maps:
The Fight for Fair Maps
Gerrymandering distorts elections by allowing politicians to choose their voters rather than letting voters choose their representatives. It leads to uncompetitive races, reduces accountability, and often results in policies that do not reflect the will of the majority. The fight against gerrymandering continues in courts, state legislatures, and through independent redistricting commissions aimed at restoring fairness to the electoral process.
Have you noticed gerrymandering in your state or district? Share your thoughts in the comments below!