Precipitation is any result of the condensation of atmospheric water vapor that drops under gravity from clouds.
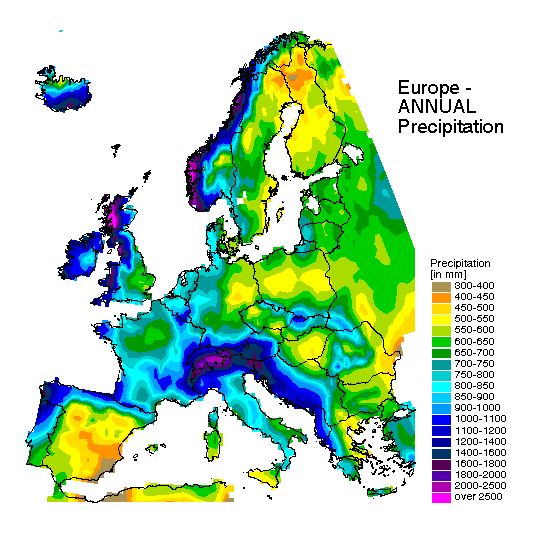
In Europe, the most precipitation falls in the north, least of all in the south. The map below reveals how the annual precipitation in depth (mm per year) ranges by country in Europe.
Annual precipitation in Europe
The map below shows the average number of days per year with precipitation. Of the major cities in Europe, the largest number of rainy days is observed in Glasgow, the least – in Spanish Almeria.
The average number of days per year with precipitation in Europe
According to European Union Agency, annual precipitation since 1960 exposes a growing trend of up to 70 mm per decade in north-eastern and north-western Europe and a reduction of up to 90 mm per decade in some parts of southern Europe. At mid-latitudes, no notable variations in annual precipitation have been recorded. Mean summer precipitation has considerably declined by up to 20 mm per decade in most of southern Europe. In contrast, notable increases of up to 18 mm per decade have been documented in northern Europe.
I would like to notify that there is a serious mistake in the map of the average days per year of precipitation concerning Brussels: 199 is the number of days with precipitaton over 0.1mm, while all other cities has the threshold of 1mm for the counting of their days with precipitation on this map!
133 is actually the real number of days with precipitation over 1mm in Brussels!


")


I would like to notify that there is a serious mistake in the map of the average days per year of precipitation concerning Brussels: 199 is the number of days with precipitaton over 0.1mm, while all other cities has the threshold of 1mm for the counting of their days with precipitation on this map!
133 is actually the real number of days with precipitation over 1mm in Brussels!