Every day, Americans use an astounding 325 billion gallons of water – enough to fill nearly half a million Olympic-sized swimming pools. But how exactly is all this water being used? A fascinating map from the United States Geological Survey (USGS) reveals the complex patterns of water consumption across the nation.
Map credit: United States Geological Survey (USGS). The map shows primary water uses across U.S. counties: thermoelectric (yellow), irrigation (green), public supply (blue), industrial (red), and other uses (gray).
Breaking Down America’s Water Usage
According to the latest USGS data, here’s how Americans use their freshwater:
Thermoelectric power: 45% (cooling for power plants)
Irrigation: 32% (agricultural needs)
Public Supply: 12% (residential and commercial use)
Industrial: 5% (manufacturing and processing)
Aquaculture: 3% (fish farming)
Mining: 2%
Self-Supplied Domestic: 1% (private wells)
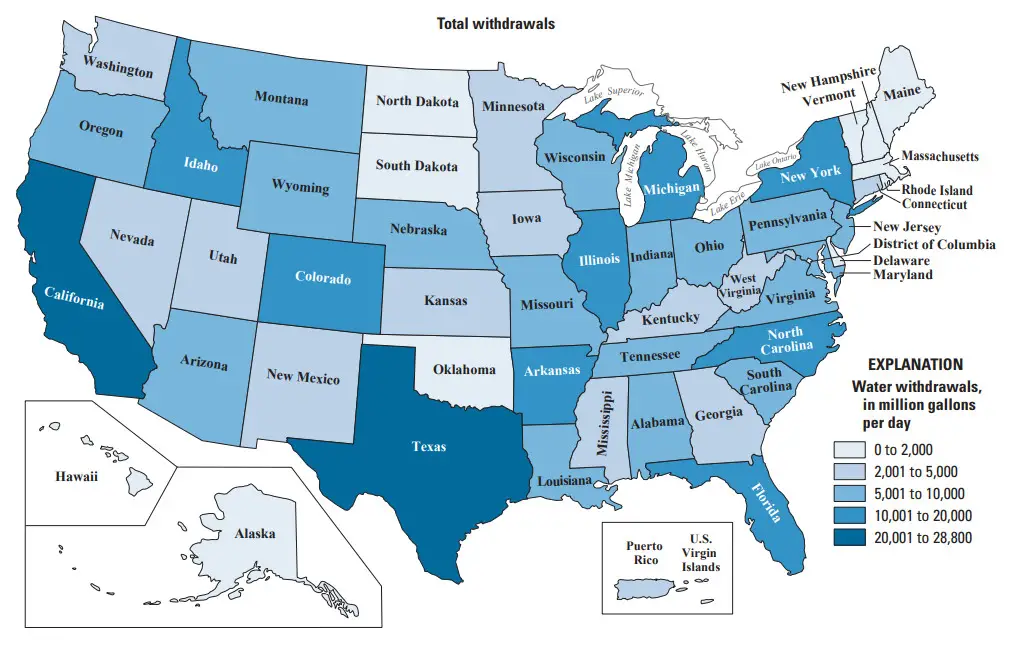
Map credit: USGS. This visualization shows water withdrawals by county in million gallons per day.
Regional Water Champions
Just twelve states account for more than half of all water withdrawals in the United States. Here’s what makes each state unique:
Florida, New York, and Maryland lead in saline water use, primarily for power generation. Florida alone accounts for 23% of all saline water withdrawals nationwide. This highlights an interesting adaptation: using seawater for cooling power plants to preserve freshwater resources.
The Future of Water Use
Current Consumption
The average American family uses more than 300 gallons of water per day at home (EPA)
Outdoor water use accounts for 30% of household consumption, mainly for landscape irrigation
Indoor usage is dominated by toilets (24%), washing machines (22%), and showers (20%)
Looking Ahead
According to the U.S. Government Accountability Office, water managers in 40 states expect water shortages in some portions of their states under average conditions in the next decade. This highlights the growing importance of water conservation and efficient use across all sectors.


")


