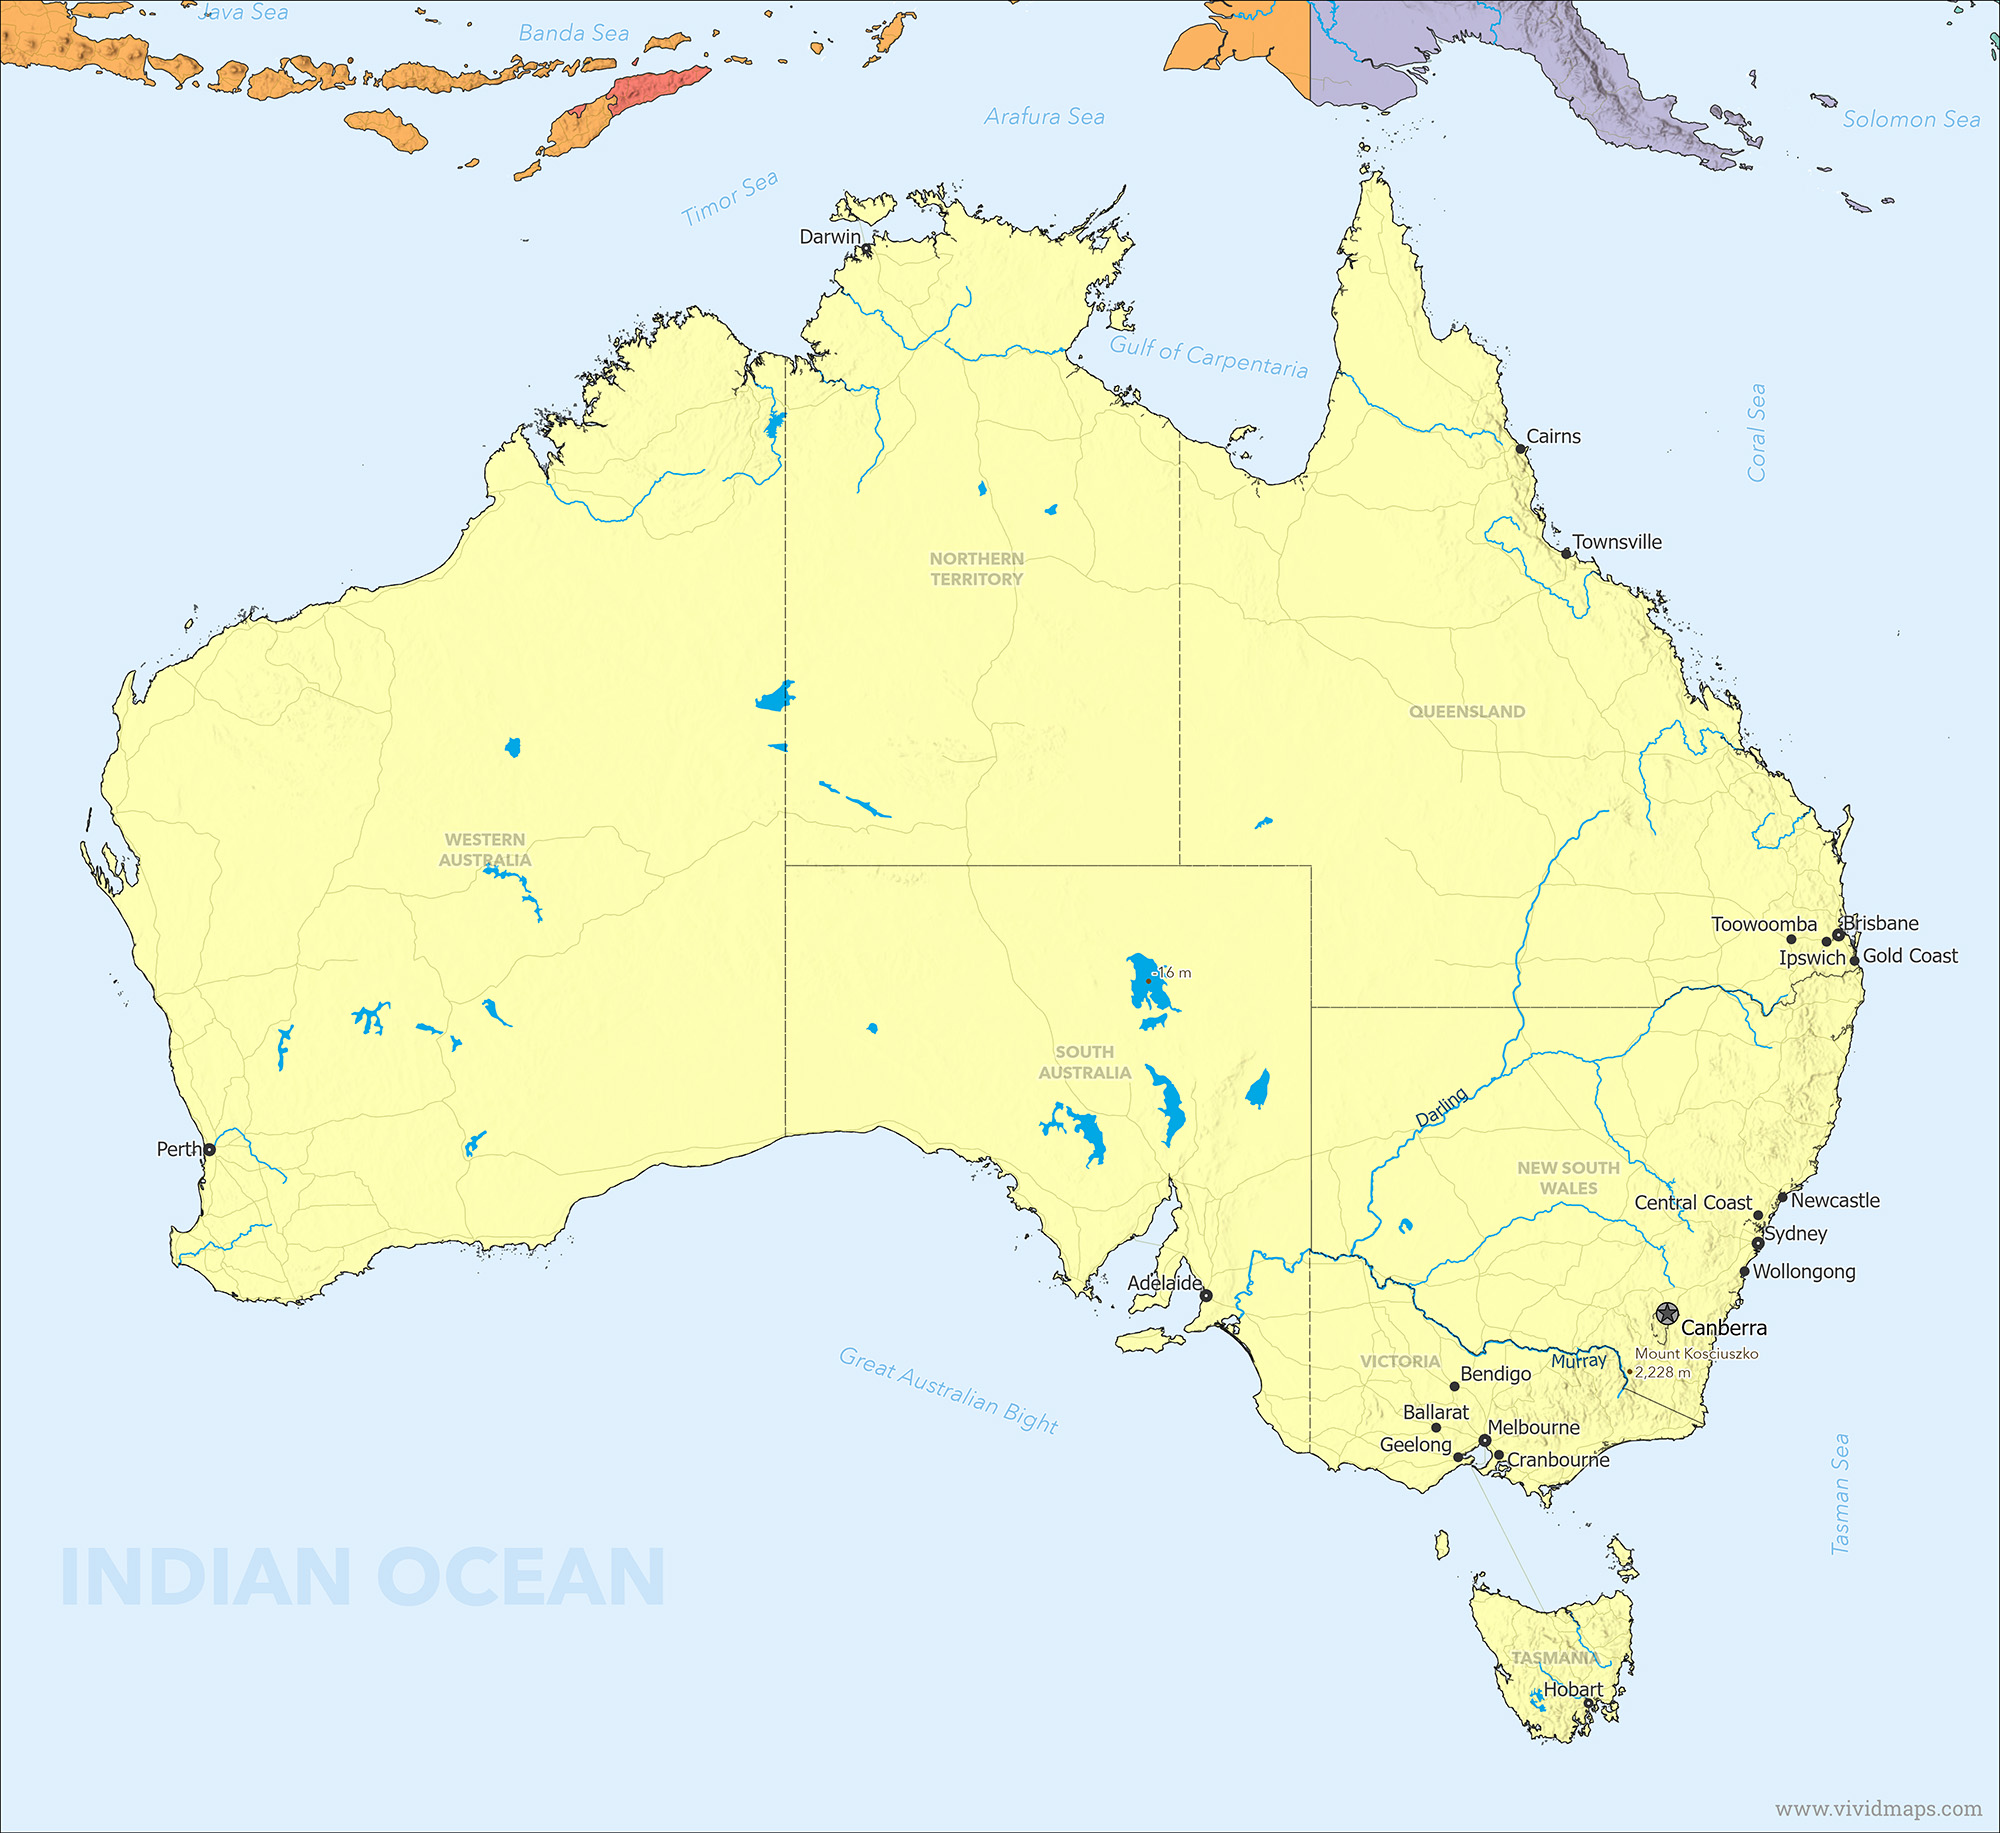
Map of Australia
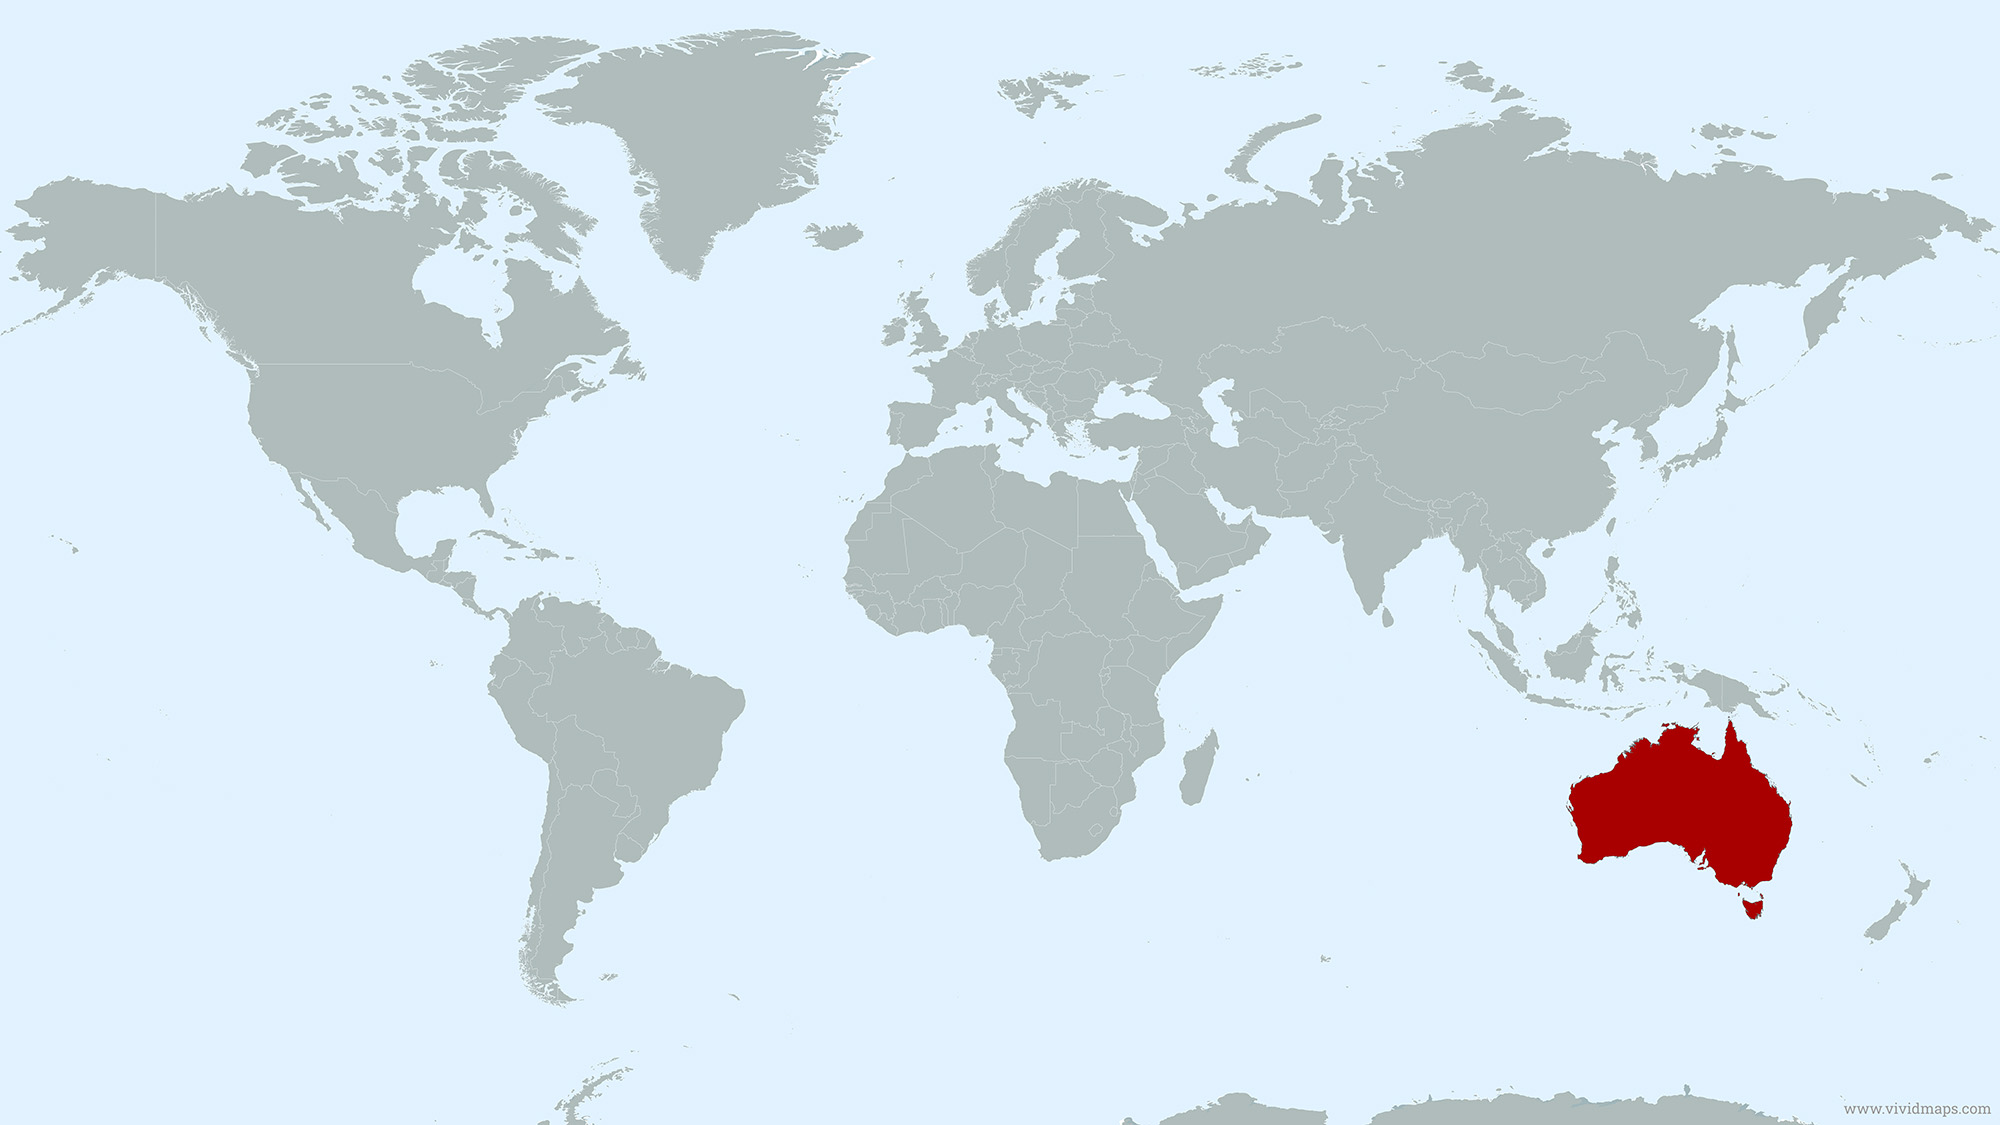
Australia Location Map
Australia Facts
Full Official Name: Australia
Demonym: Australian
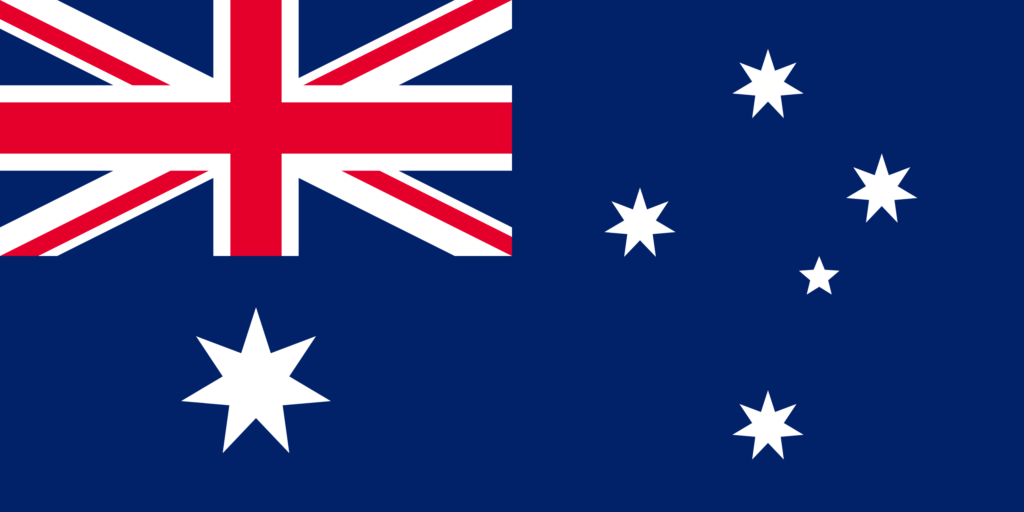
Flag:
Area
Total Area: 7,741,220 km² (2,988,902 mi²)
Land Area: 7,682,300 km² (approx.)
Water Area: 58,920 km² (approx.)
Highest and Lowest Points
Highest Point: Mount Kosciuszko — 2,228 m (7,310 ft)
Lowest Point: Lake Eyre (Kati Thanda) — −15 m (−49 ft)
Demographics
Population: ~28,109,700 (2025 est.)
Population Growth Rate: ~1.7% (2024 est.)
Largest City: Sydney — ~5.6 million (2024, metro)
Ethnic Groups: Major groups include English 33%, Australian 29.9%, Irish 9.5%, Scottish 8.6%, Chinese 5.5%, Italian 4.4%, German 4%, Indian 3.1%, Australian Aboriginal 2.9%, Greek 1.7%
Languages: English 72%, Mandarin 2.7%, Arabic 1.4%, Vietnamese 1.3%, Cantonese 1.2%, other 15.7%, unspecified 5.7% (2021 est.)
Religions:Catholic 20%, Protestant 18.1%, Orthodox 2.3%, other Christian 3.5%, Muslim 3.2%, Hindu 2.7%, Buddhist 2.4%, other 2.1%, none 38.4%
Economy
Currency: Australian Dollar (AUD)
Real GDP (Purchasing Power Parity): ~$1.98 trillion USD (2025 est.)
GDP per Capita (PPP): ~$72,138 USD (2025 est.)
Gini Index: ~34.3 (2025)
Human Development Index (HDI): 0.958 (2023)
Exports: ~$417 billion USD (2023 est.)
Main Export Partners: China 40%, Japan 14%, South Korea 9%, India 6%, Taiwan 4% (2021)
Imports: ~$388 billion USD (2023 est.)
Main Import Partners: China 28%, United States 10%, Japan 6%, Germany 5%, Thailand 5% (2021)
Government
Type: Federal parliamentary constitutional monarchy
Capital City: Canberra – 473,855 (2024)
Other Facts
Time Zones: UTC +8 to +10.5 (standard)
Country Code: AU
Internet TLD: .au
Dialing code: +61
Climate Map of Australia
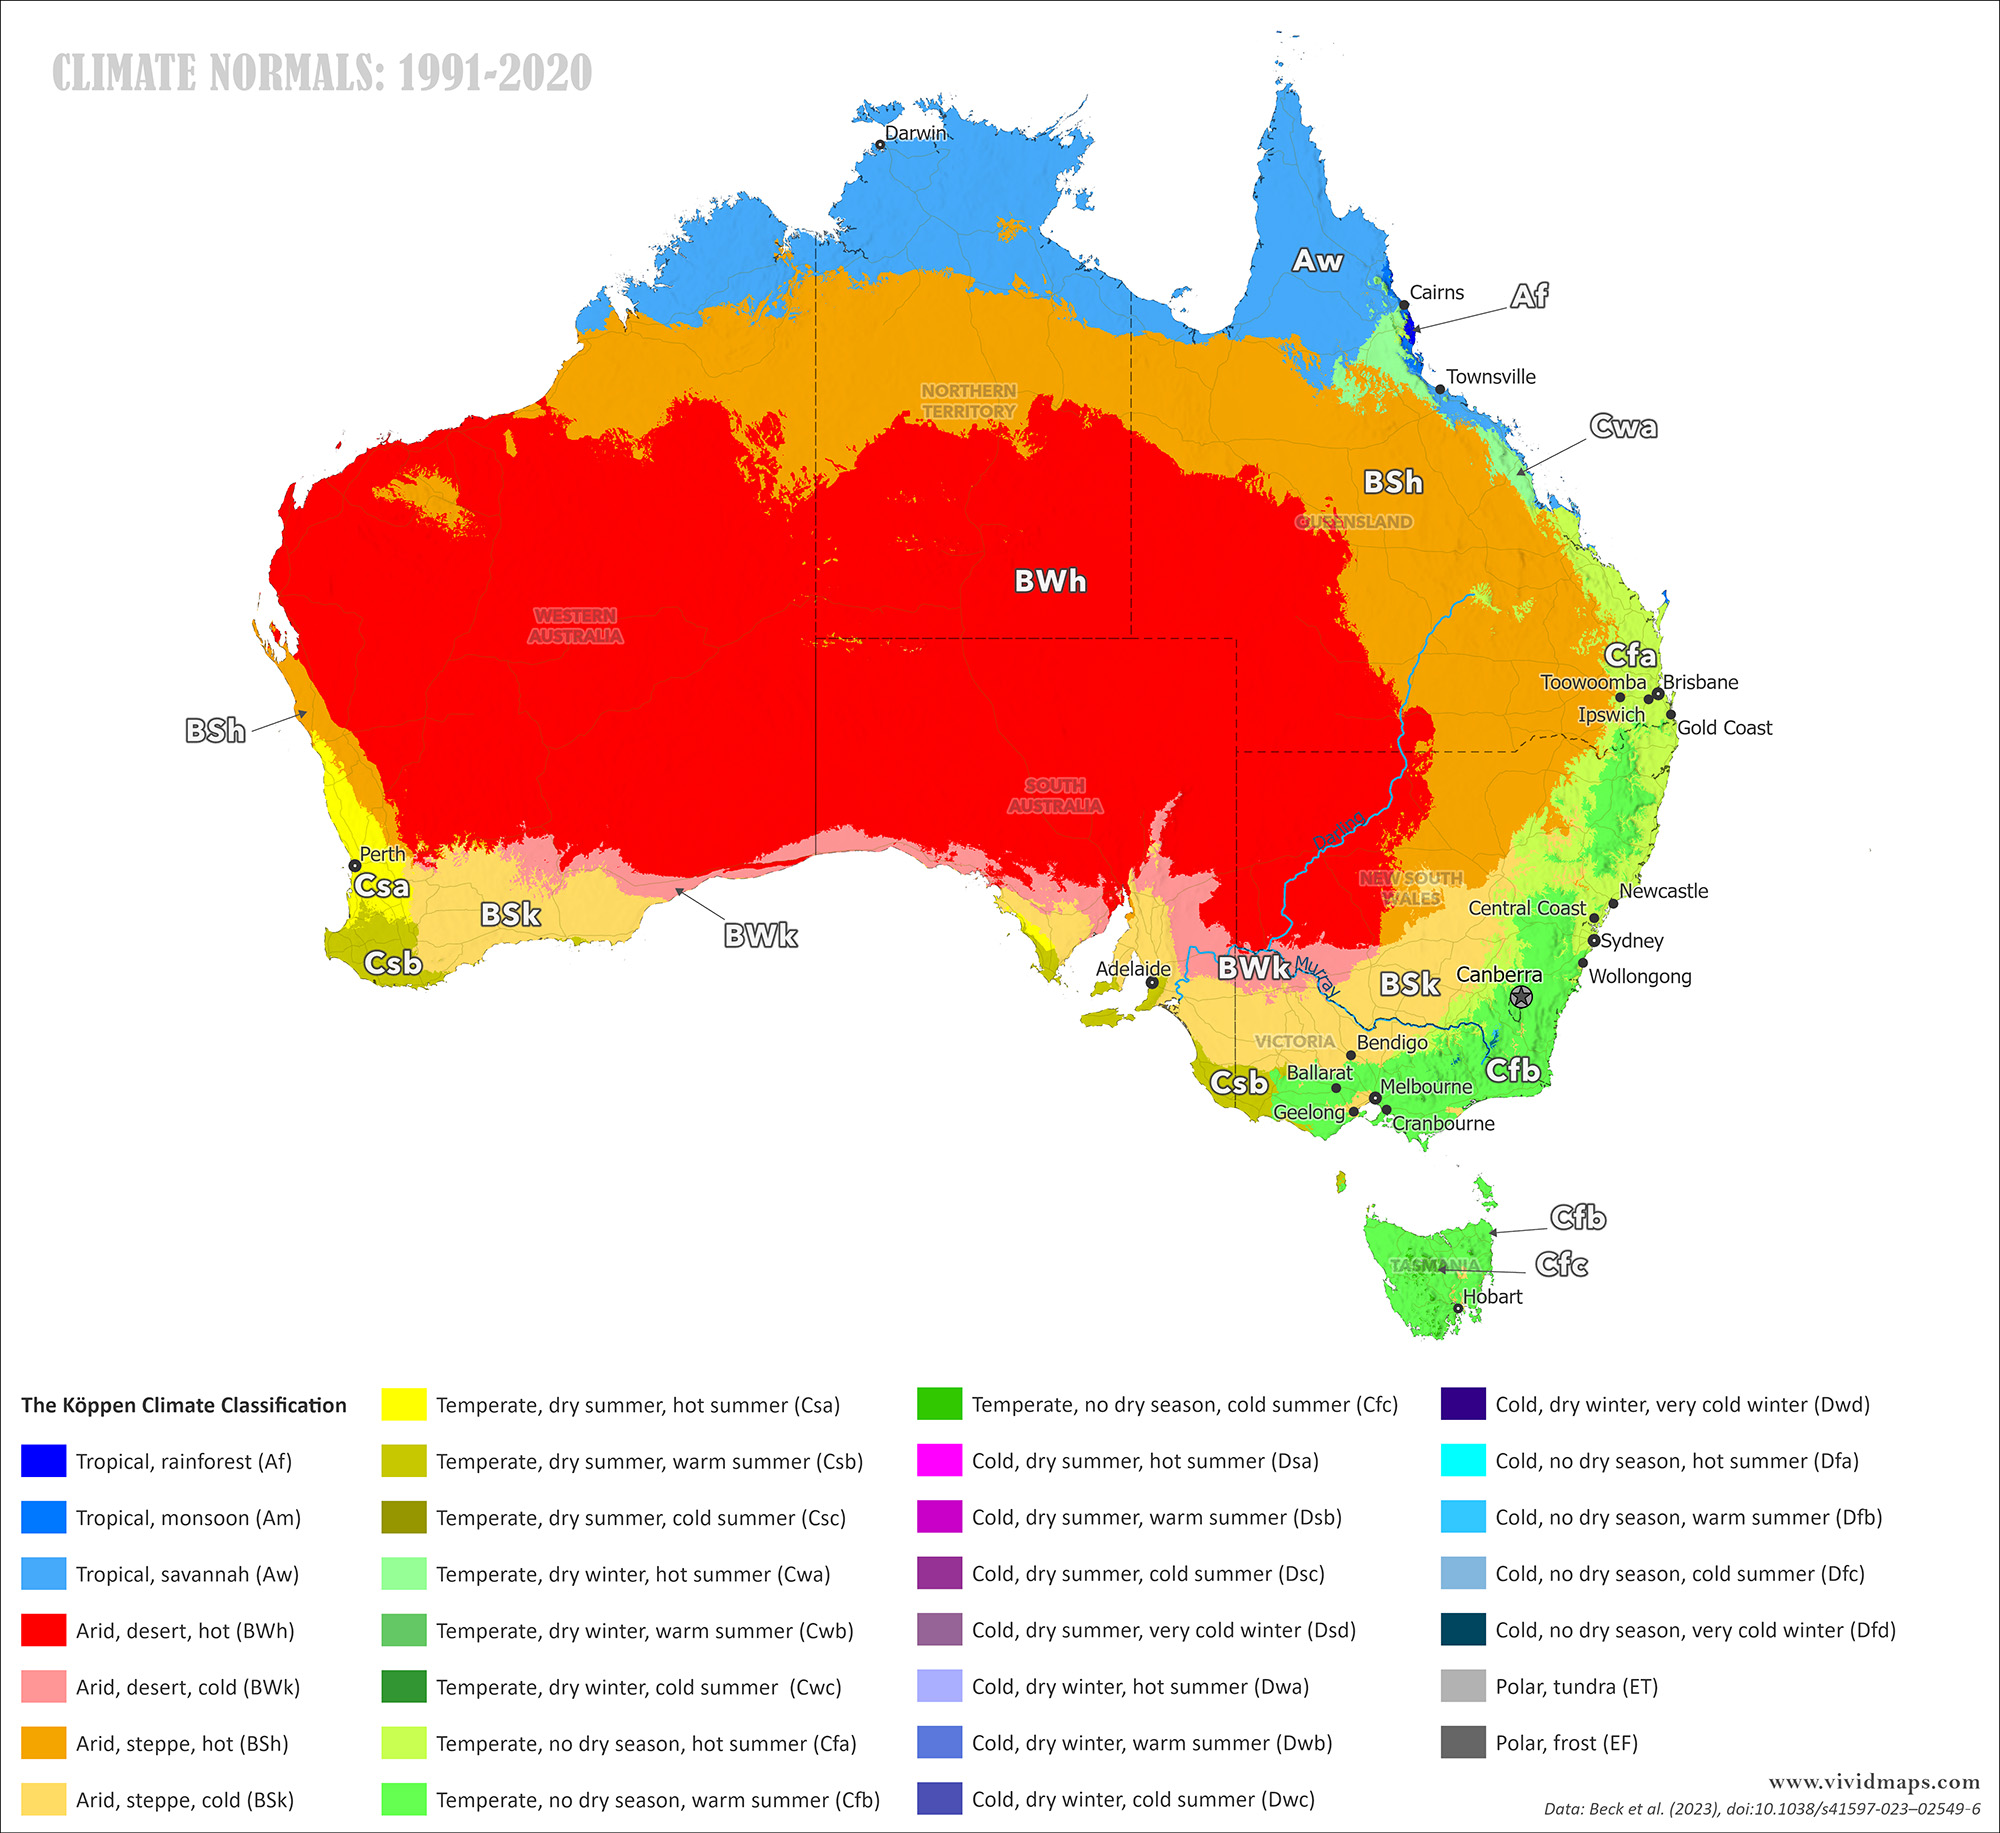
Australia’s climate is highly varied: arid and semi-arid in the interior, tropical in the north, temperate in the south and along the east coast, Mediterranean in the south-west.
Climate of Major Cities (1991–2020 normals)
Average Daily Mean Temperature — °C (°F)
| City | Jan | Feb | Mar | Apr | May | Jun | Jul | Aug | Sep | Oct | Nov | Dec | Year | Köppen System |
|---|---|---|---|---|---|---|---|---|---|---|---|---|---|---|
| Sydney | 23.5 (74.3) | 23.4 (74.1) | 22.1 (71.8) | 19.5 (67.1) | 16.9 (62.4) | 15.2 (59.4) | 14.8 (58.6) | 15.9 (60.6) | 17.8 (64.0) | 19.9 (67.8) | 21.5 (70.7) | 22.8 (73.0) | 18.4 (65.1) | Cfa |
| Melbourne | 20.2 (68.4) | 20.3 (68.5) | 18.9 (66.0) | 15.9 (60.6) | 13.1 (55.6) | 11.2 (52.2) | 10.8 (51.4) | 11.3 (52.3) | 13.3 (55.9) | 15.9 (60.6) | 18.1 (64.6) | 19.4 (66.9) | 15.8 (60.4) | Cfb |
| Brisbane | 21.5 (70.7) | 21.9 (71.4) | 21.7 (71.1) | 19.5 (67.1) | 17.8 (64.0) | 16.5 (61.7) | 16.1 (61.0) | 16.6 (61.9) | 18.4 (65.1) | 19.9 (67.8) | 20.8 (69.4) | 21.1 (70.0) | 19.1 (66.4) | Cfa |
| Perth | 21.9 (71.4) | 22.2 (72.0) | 20.8 (69.4) | 17.3 (63.1) | 14.9 (58.8) | 12.8 (55.0) | 12.5 (54.5) | 13.3 (55.9) | 15.8 (60.4) | 17.9 (64.2) | 19.9 (67.8) | 21.3 (70.3) | 17.6 (63.7) | Csa |
| Adelaide | 22.1 (71.8) | 22.4 (72.3) | 20.8 (69.4) | 17.6 (63.7) | 14.9 (58.8) | 12.8 (55.0) | 12.4 (54.3) | 13.1 (55.6) | 15.5 (59.9) | 17.8 (64.0) | 19.7 (67.5) | 21.2 (70.2) | 17.1 (62.8) | Csa |
Average Monthly Precipitation — mm
| City | Jan | Feb | Mar | Apr | May | Jun | Jul | Aug | Sep | Oct | Nov | Dec | Year | Köppen System |
|---|---|---|---|---|---|---|---|---|---|---|---|---|---|---|
| Sydney | 101.2 | 119.3 | 131.6 | 126.5 | 117.4 | 133.1 | 96.3 | 80.2 | 68.1 | 76.7 | 83.8 | 77.1 | 1,211 | Cfa |
| Melbourne | 47 | 48 | 50 | 57 | 56 | 50 | 48 | 50 | 58 | 66 | 60 | 59 | 649 | Cfb |
| Brisbane | 134 | 124 | 100 | 80 | 65 | 45 | 40 | 50 | 80 | 110 | 140 | 155 | 1,223 | Cfa |
| Perth | 78 | 63 | 85 | 60 | 45 | 40 | 38 | 40 | 45 | 60 | 75 | 90 | 719 | Csa |
| Adelaide | 103 | 83 | 75 | 55 | 50 | 40 | 38 | 50 | 60 | 68 | 100 | 105 | 827 | Csa |
Read More About Australia
Official Australian Government Website
Australia on the CIA World Factbook
Australia on Wikipedia
Australia on Britannica
Australia on National Geographic Kids