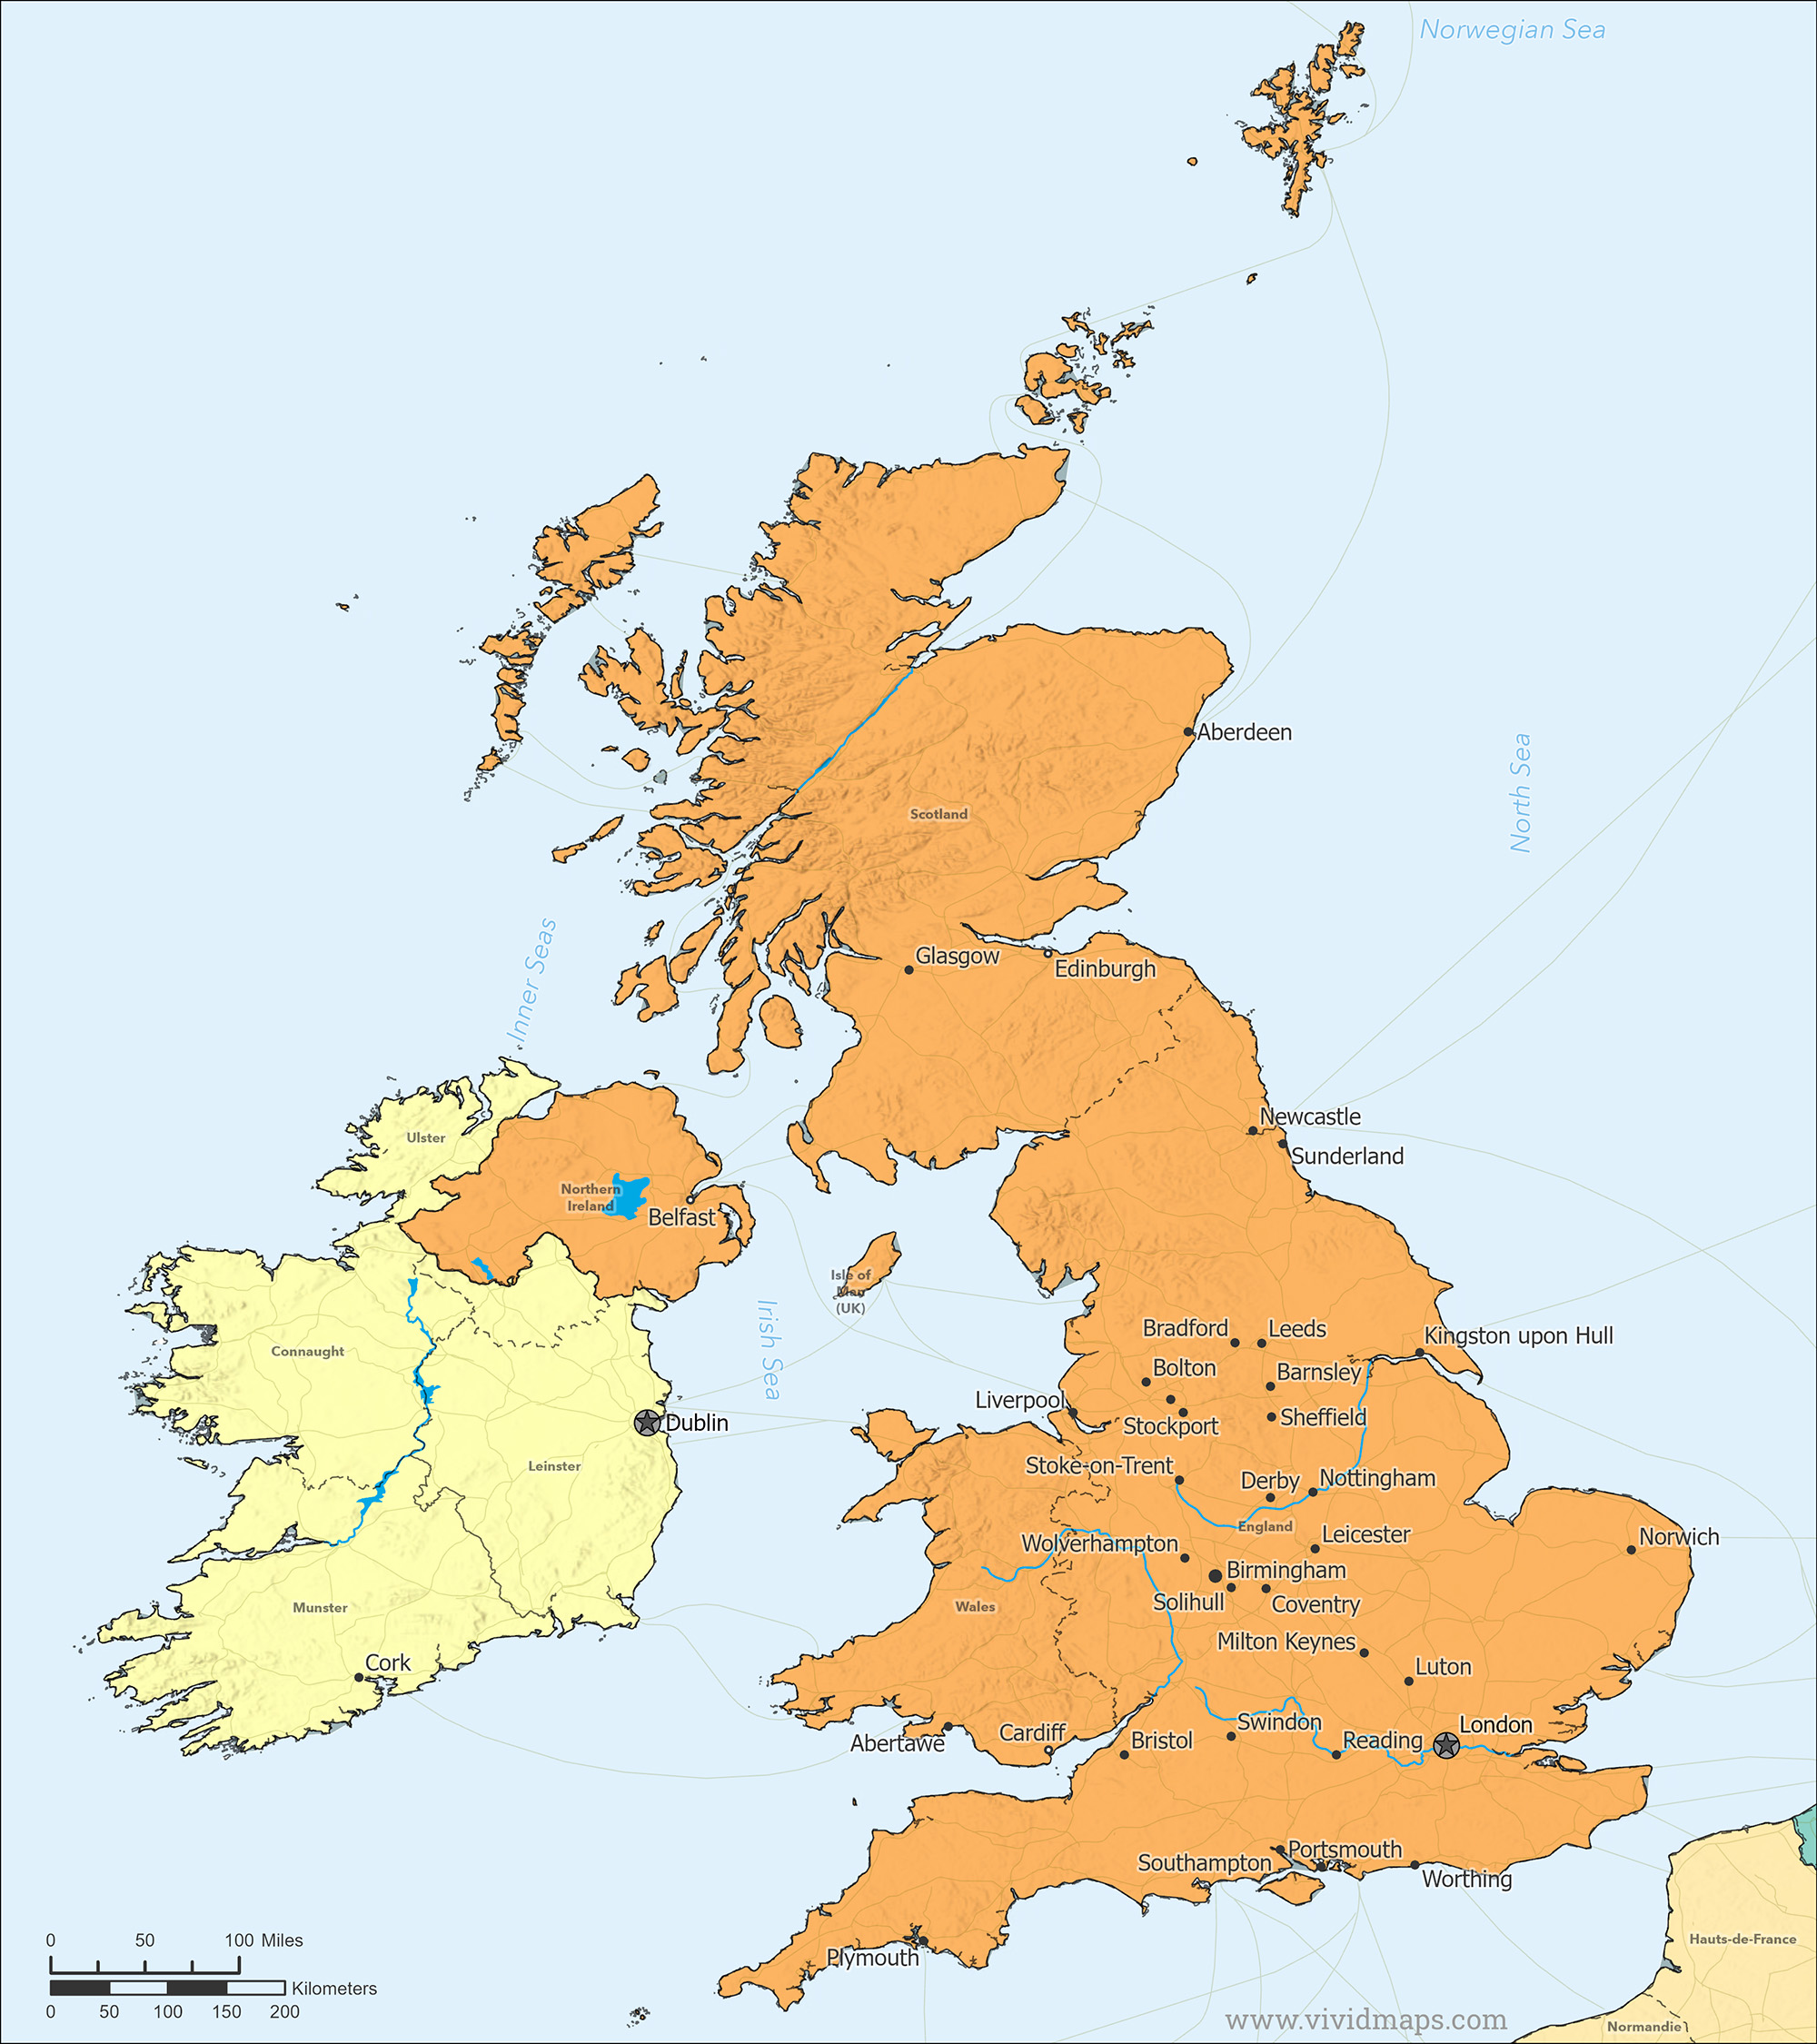
Map of the United Kingdom
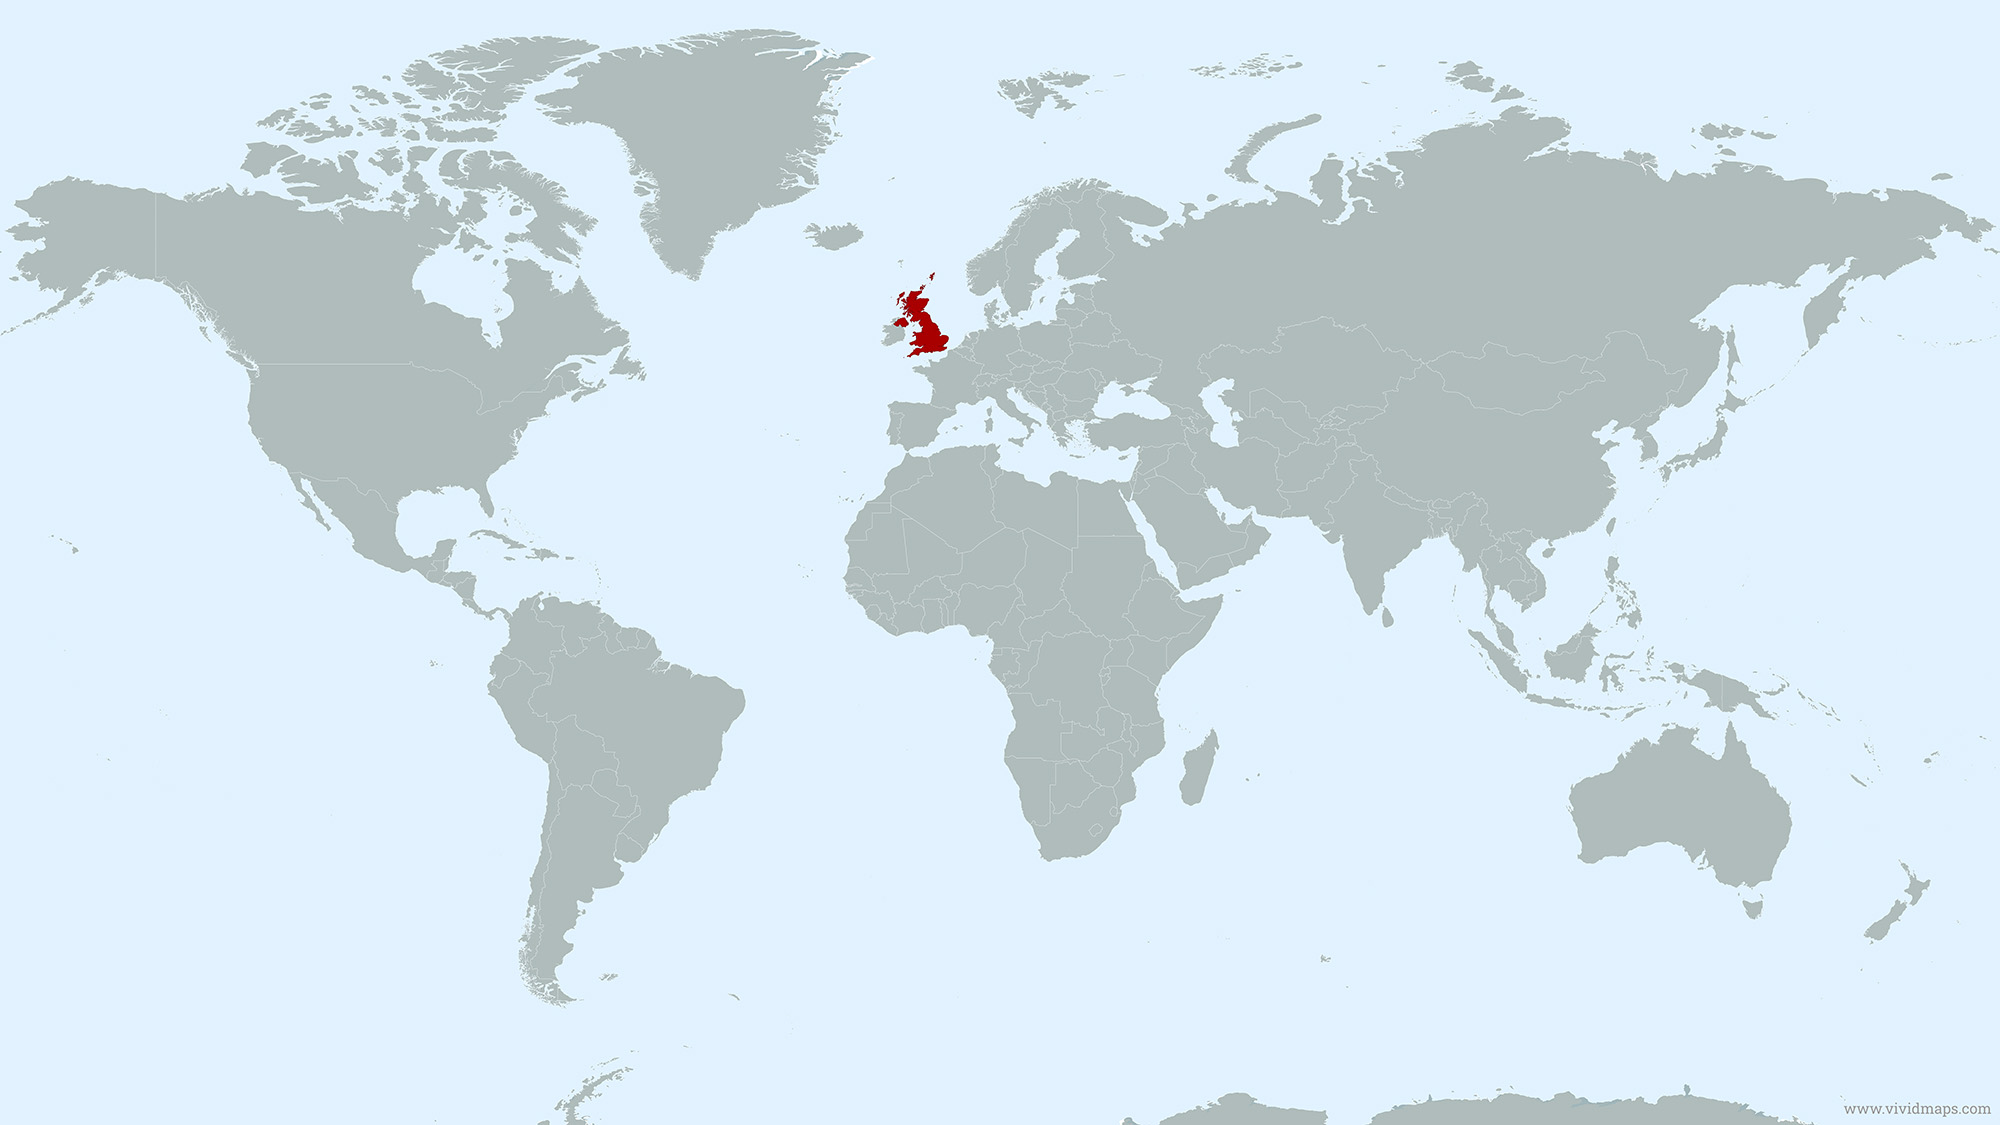
United Kingdom Location Map
United Kingdom Facts
Full Official Name: United Kingdom of Great Britain and Northern Ireland
Demonym: British
Flag:
Area
Total Area: 243,610 km² (94,060 mi²)
Land Area: 241,930 km² (93,410 mi²)
Water Area: 1,680 km² (650 mi²)
Highest and Lowest Points
Highest Point: Ben Nevis — 1,345 m (4,413 ft)
Lowest Point: The Fens (Holme Fen, Cambridgeshire) — −2.75 m (−9 ft)
Demographics
Population: 69,281,437 (2024 est.)
Population Growth Rate: 0.45% (2024 est.)
Largest City: London — 9,089,736 inhabitants
Ethnic Groups:
White 82.7%, Asian 8.6%, Black 3.7%, Mixed 2.7%, Other 2% (2021 est.)
Languages:
English (official), Welsh (in Wales), Scots, Scottish Gaelic, Irish, Ulster Scots, Cornish
Religions:
Christian 46.5%, no religion 37.8%, Muslim 6.0%, Hindu 1.6%, Sikh 0.8%, Jewish 0.4%, Buddhist 0.4%, Other 5.9% (2021 est.)
Economy
Currency: Pound Sterling (GBP)
Real GDP (PPP): $4.45 trillion (2025 est.)
GDP per Capita (PPP): $63,66 (2025 est.)
Gini Index: 34.1 (2024 est.)
Human Development Index (HDI): 0.946 (2023)
Exports: $1.117 trillion (2024 est.)
Main Export Partners: United States 14%, China 8%, Germany 9%, Netherlands 7%, Ireland 7% (2023)
Imports: $1.158 trillion (2024 est.)
Main Import Partners: China 13%, United States 11%, Germany 10%, France 5%, Norway 4% (2023)
Government
Type: Constitutional monarchy and parliamentary democracy
Capital City: London — population 9,089,736
Other Facts
Time Zone: UTC +0 (GMT); UTC +1 (BST, daylight saving)
Country Code: GB
Internet TLD: .uk
Dialing code: +44
Climate Map of the United Kingdom
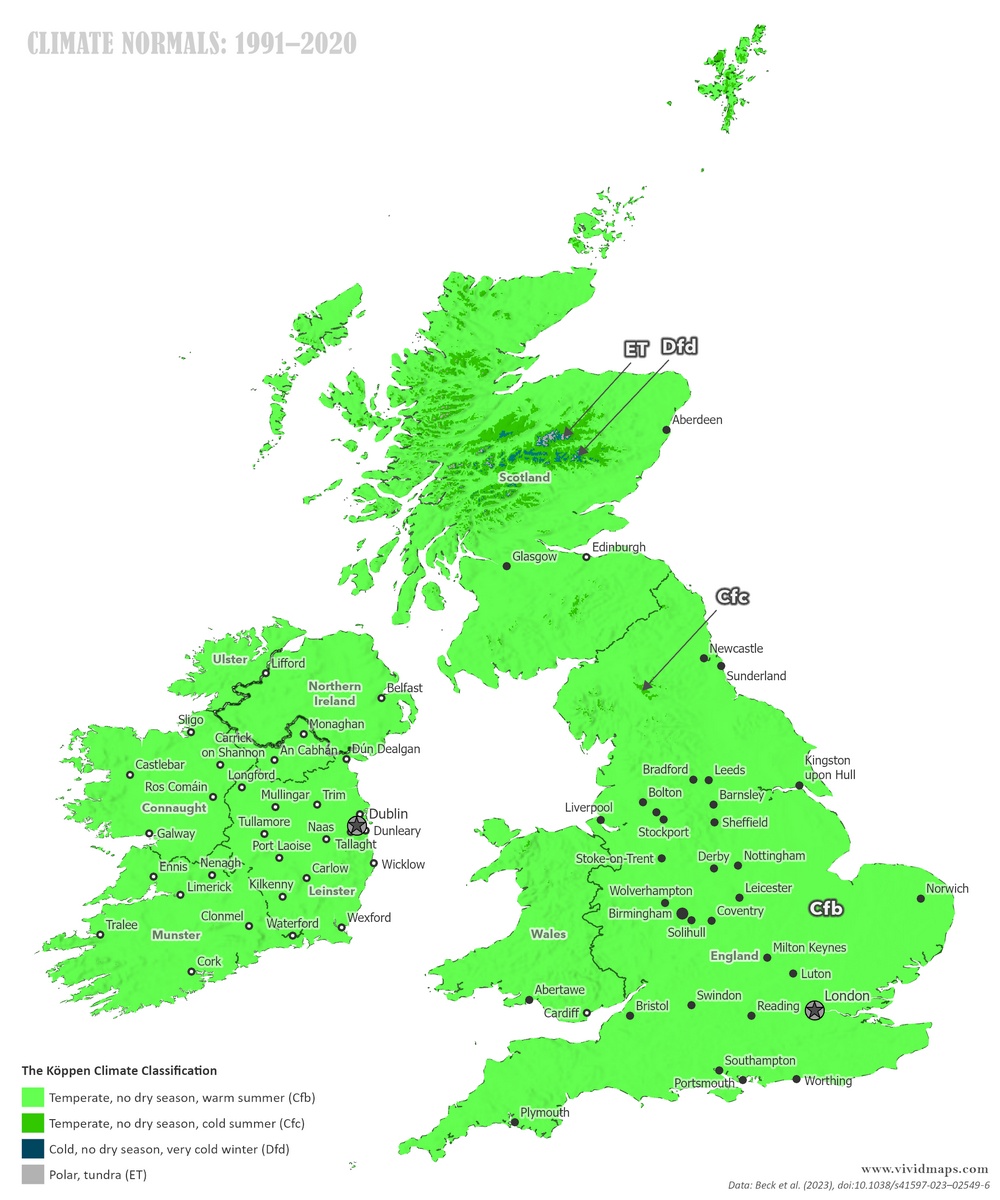
The climate of the United Kingdom is mostly temperate maritime, influenced by the Atlantic Ocean and the Gulf Stream. Winters are mild, summers are cool to warm, and rainfall is evenly distributed throughout the year. Western regions are wetter, while southeastern England is relatively drier.
Climate of Major Cities (1991–2020 Normals)
Average Daily Mean Temperature — °C (°F)
| City | Jan | Feb | Mar | Apr | May | Jun | Jul | Aug | Sep | Oct | Nov | Dec | Year | Köppen System |
|---|---|---|---|---|---|---|---|---|---|---|---|---|---|---|
| London | 4.9 (40.8) | 5.2 (41.4) | 7.3 (45.1) | 9.8 (49.6) | 12.8 (55.0) | 15.8 (60.4) | 18.0 (64.4) | 17.8 (64.0) | 15.1 (59.2) | 11.6 (52.9) | 7.8 (46.0) | 5.3 (41.5) | 10.9 (51.6) | Cfb |
| Birmingham | 3.9 (39.0) | 4.0 (39.2) | 6.1 (43.0) | 7.8 (46.0) | 11.0 (51.8) | 13.9 (57.0) | 16.5 (61.7) | 16.1 (61.0) | 13.5 (56.3) | 10.0 (50.0) | 6.5 (43.7) | 4.7 (40.5) | 9.5 (49.1) | Cfb |
| Liverpool | 5.2 (41.4) | 5.3 (41.5) | 6.9 (44.4) | 9.2 (48.6) | 12.1 (53.8) | 14.9 (58.8) | 16.7 (62.1) | 16.6 (61.9) | 14.5 (58.1) | 11.4 (52.5) | 8.1 (46.6) | 5.6 (42.1) | 10.5 (50.9) | Cfb |
| Nottingham | 4.3 (39.7) | 4.7 (40.5) | 6.5 (43.7) | 9.0 (48.2) | 11.9 (53.4) | 14.8 (58.6) | 16.9 (62.4) | 16.7 (62.1) | 14.2 (57.6) | 10.7 (51.3) | 7.0 (44.6) | 4.6 (40.3) | 10.1 (50.2) | Cfb |
| Sheffield | 3.8 (38.8) | 4.1 (39.4) | 6.4 (43.5) | 8.8 (47.8) | 12.3 (54.1) | 15.0 (59.0) | 17.3 (63.1) | 16.9 (62.4) | 14.2 (57.6) | 10.5 (50.9) | 7.0 (44.6) | 4.1 (39.4) | 10.0 (50.0) | Cfb |
| Bristol | 5.3 (41.5) | 5.5 (41.9) | 7.3 (45.1) | 9.7 (49.5) | 12.7 (54.9) | 15.6 (60.1) | 17.6 (63.7) | 17.2 (63.0) | 14.9 (58.8) | 11.6 (52.9) | 8.0 (46.4) | 5.6 (42.1) | 10.9 (51.6) | Cfb |
| Glasgow | 4.6 (40.3) | 5.0 (41.0) | 6.5 (43.7) | 9.0 (48.2) | 11.8 (53.2) | 14.3 (57.7) | 15.9 (60.6) | 15.6 (60.1) | 13.3 (55.9) | 9.9 (49.8) | 6.9 (44.4) | 4.7 (40.5) | 9.8 (49.6) | Cfb |
| Leicester | 4.3 (39.7) | 4.7 (40.5) | 7.2 (45.0) | 9.7 (49.5) | 13.3 (55.9) | 15.9 (60.6) | 18.4 (65.1) | 18.0 (64.4) | 15.2 (59.4) | 11.3 (52.3) | 7.4 (45.3) | 4.7 (40.5) | 10.7 (51.3) | Cfb |
| Edinburgh | 3.8 (38.8) | 4.0 (39.2) | 5.9 (42.6) | 7.9 (46.2) | 11.0 (51.8) | 13.8 (56.8) | 15.8 (60.4) | 15.7 (60.3) | 13.1 (55.6) | 9.7 (49.5) | 6.3 (43.3) | 4.0 (39.2) | 9.7 (49.5) | Cfb |
| Leeds | 3.9 (39.0) | 4.3 (39.7) | 6.4 (43.5) | 8.7 (47.7) | 12.1 (53.8) | 15.0 (59.0) | 17.3 (63.1) | 17.0 (62.6) | 14.5 (58.1) | 10.8 (51.4) | 7.2 (45.0) | 4.3 (39.7) | 10.2 (50.4) | Cfb |
| Cardiff | 5.6 (42.1) | 5.9 (42.6) | 7.6 (45.7) | 10.1 (50.2) | 13.0 (55.4) | 15.7 (60.3) | 17.5 (63.5) | 17.2 (63.0) | 14.9 (58.8) | 11.7 (53.1) | 8.3 (46.9) | 6.0 (42.8) | 11.1 (52.0) | Cfb |
Average Monthly Precipitation — mm
| City | Jan | Feb | Mar | Apr | May | Jun | Jul | Aug | Sep | Oct | Nov | Dec | Year | Köppen System |
|---|---|---|---|---|---|---|---|---|---|---|---|---|---|---|
| London | 69.5 | 51.4 | 42.8 | 49.6 | 50.5 | 58.5 | 50.5 | 67.7 | 59.1 | 78.6 | 75.7 | 68.3 | 722.1 | Cfb |
| Birmingham | 62 | 46 | 49 | 52 | 59 | 64 | 63 | 67 | 64 | 73 | 71 | 65 | 735 | Cfb |
| Liverpool | 74.9 | 54.4 | 63.6 | 54.3 | 54.9 | 66.2 | 59 | 68.9 | 71.7 | 97.3 | 82.6 | 88.8 | 836.6 | Cfb |
| Nottingham | 55 | 41 | 45 | 47 | 54 | 57 | 56 | 59 | 61 | 65 | 64 | 59 | 723 | Cfb |
| Sheffield | 77 | 55 | 59 | 60 | 65 | 67 | 69 | 78 | 86 | 92 | 88 | 83 | 919 | Cfb |
| Bristol | 85 | 61 | 61 | 57 | 60 | 63 | 65 | 74 | 78 | 92 | 93 | 91 | 920 | Cfb |
| Glasgow | 124 | 91 | 93 | 76 | 75 | 77 | 89 | 104 | 114 | 130 | 128 | 127 | 1,228 | Cfb |
| Leicester | 54 | 39 | 43 | 47 | 52 | 58 | 56 | 61 | 61 | 67 | 63 | 57 | 718 | Cfb |
| Edinburgh | 71 | 52 | 58 | 45 | 49 | 61 | 70 | 80 | 83 | 86 | 78 | 73 | 806 | Cfb |
| Leeds | 71 | 52 | 55 | 53 | 60 | 67 | 66 | 70 | 74 | 80 | 76 | 71 | 815 | Cfb |
| Cardiff | 103 | 77 | 77 | 69 | 74 | 72 | 79 | 90 | 91 | 104 | 109 | 103 | 1,048 | Cfb |
Find out how the UK climate may change in the future here.
Read More About the United Kingdom
- Official UK Government Website
- United Kingdom on the CIA World Factbook
- United Kingdom on Wikipedia
- United Kingdom on Britannica
- United Kingdom on National Geographic Kids
See other country maps here.