This post may contain affiliate links. As an Amazon Associate, we earn from qualifying purchases.
There are broad types of economic inequality, most notably estimated using the distribution of income and the distribution of wealth.
The distribution of wealth is typically the contrast between the richest of the rich and the poorest of the poor in a given country or administrative divisions (state, province, region, city) or demographic strata. Wealth inequality is near connected to income inequality, which tracks the money individuals earn. However, wealth inequality comprises income and the value of bank accounts, stocks and investments, residences, and other personal possessions, such as yachts, cars, gold, jewelry, painting, etc. Wealth inequality is a significant reason for unequal living standards in many societies.
Reddit user rubenbmathisen made fascinating maps of Global wealth inequality in 2021, visualized by comparing the bottom 80% with increasingly smaller groups at the top of the distribution.
Here is the map created by Rube Mathisen showing the percentage of national wealth owned by the bottom 80 percent.
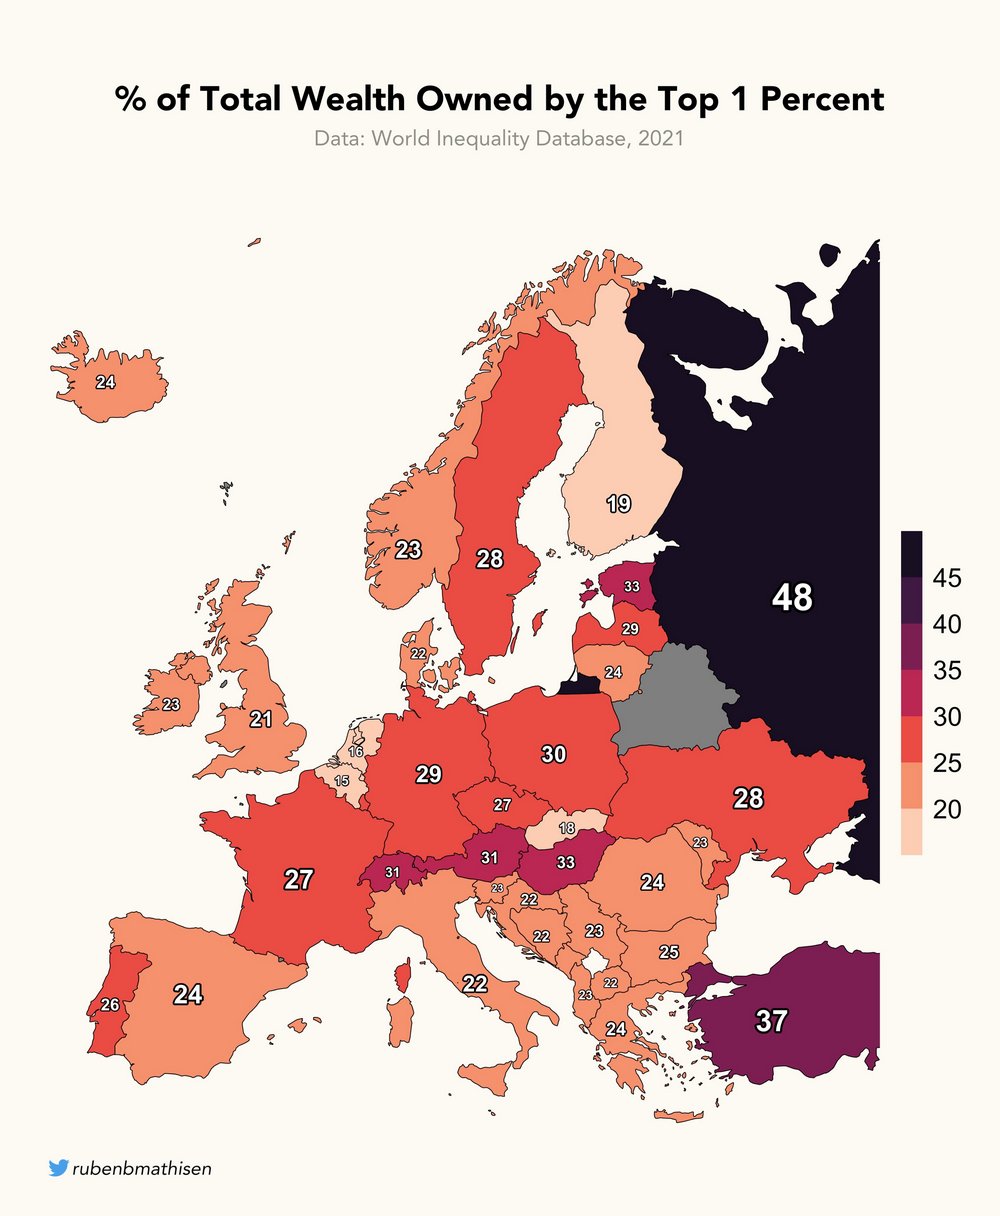
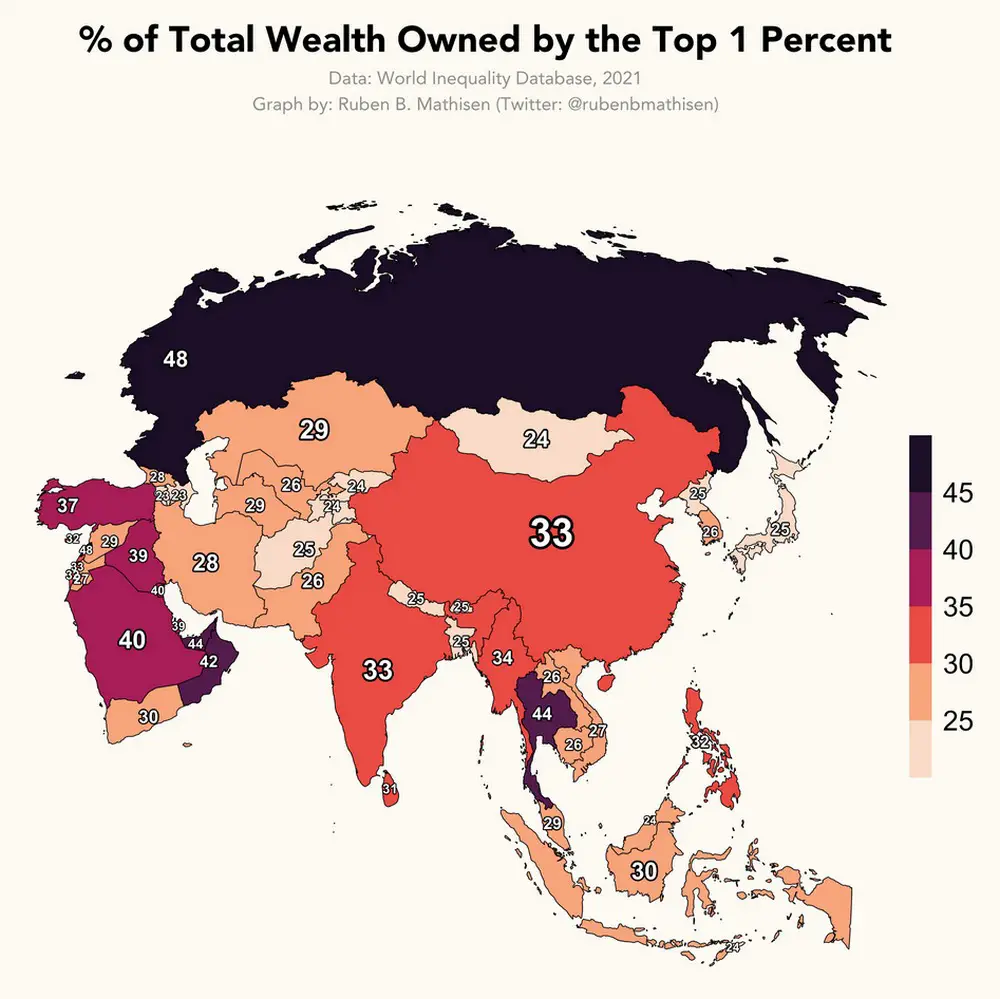
What percentage of total national wealth is owned by the top 1% in the World?
The highest percentage of total national wealth is owned by the top 1% in Europe – Russia (48%), in the Americas – Chile (49%), in Africa – South Africa (55%), and in Asia – Lebanon (48%).
Research reveals that globalization has decreased global wealth inequality between countries but has grown wealth inequality within countries. Generally, developing nations are defined by more significant inequality than developed countries. However, there are anomalies to this law: in some developed nations, such as the United States, the Gini coefficient is high.
The Gini index or coefficient is a statistical estimation of wealth distribution developed by the Italian demographer Corrado Gini. The Gini coefficient varies from 0 to 1. A 0 (0%) coefficient means ideal equality, a nation in which everyone has an identical income. The closer to 1 (or 100%) the coefficient is, the more significant the wealth inequality.
Below are the lists of the countries with the highest and lowest Wealth Inequality according to the World Bank.
Top 10 Countries with the Lowest Wealth Inequality
Rank
Country
Gini Index, %
1
Slovenia
24.6
2
Czech Republic
25.0
3
Slovakia
25.0
4
Belarus
25.3
5
Moldova
25.7
6
United Arab Emirates
26.0
7
Iceland
26.1
8
Azerbaijan
26.6
9
Ukraine
26.6
10
Belgium
27.2
Top 10 Countries with the Highest Wealth Inequality


Came here looking for copper but found gold
Equal Wealth Distribution Globally and Locally