How Alcohol Consumption Changed around the World
People have been fermenting stuff into alcohol for thousands of years—barley, grapes, honey, whatever was available. These days it’s part of nearly everything: weddings, funerals, dinners out, backyard barbecues.
But what do the numbers actually look like?
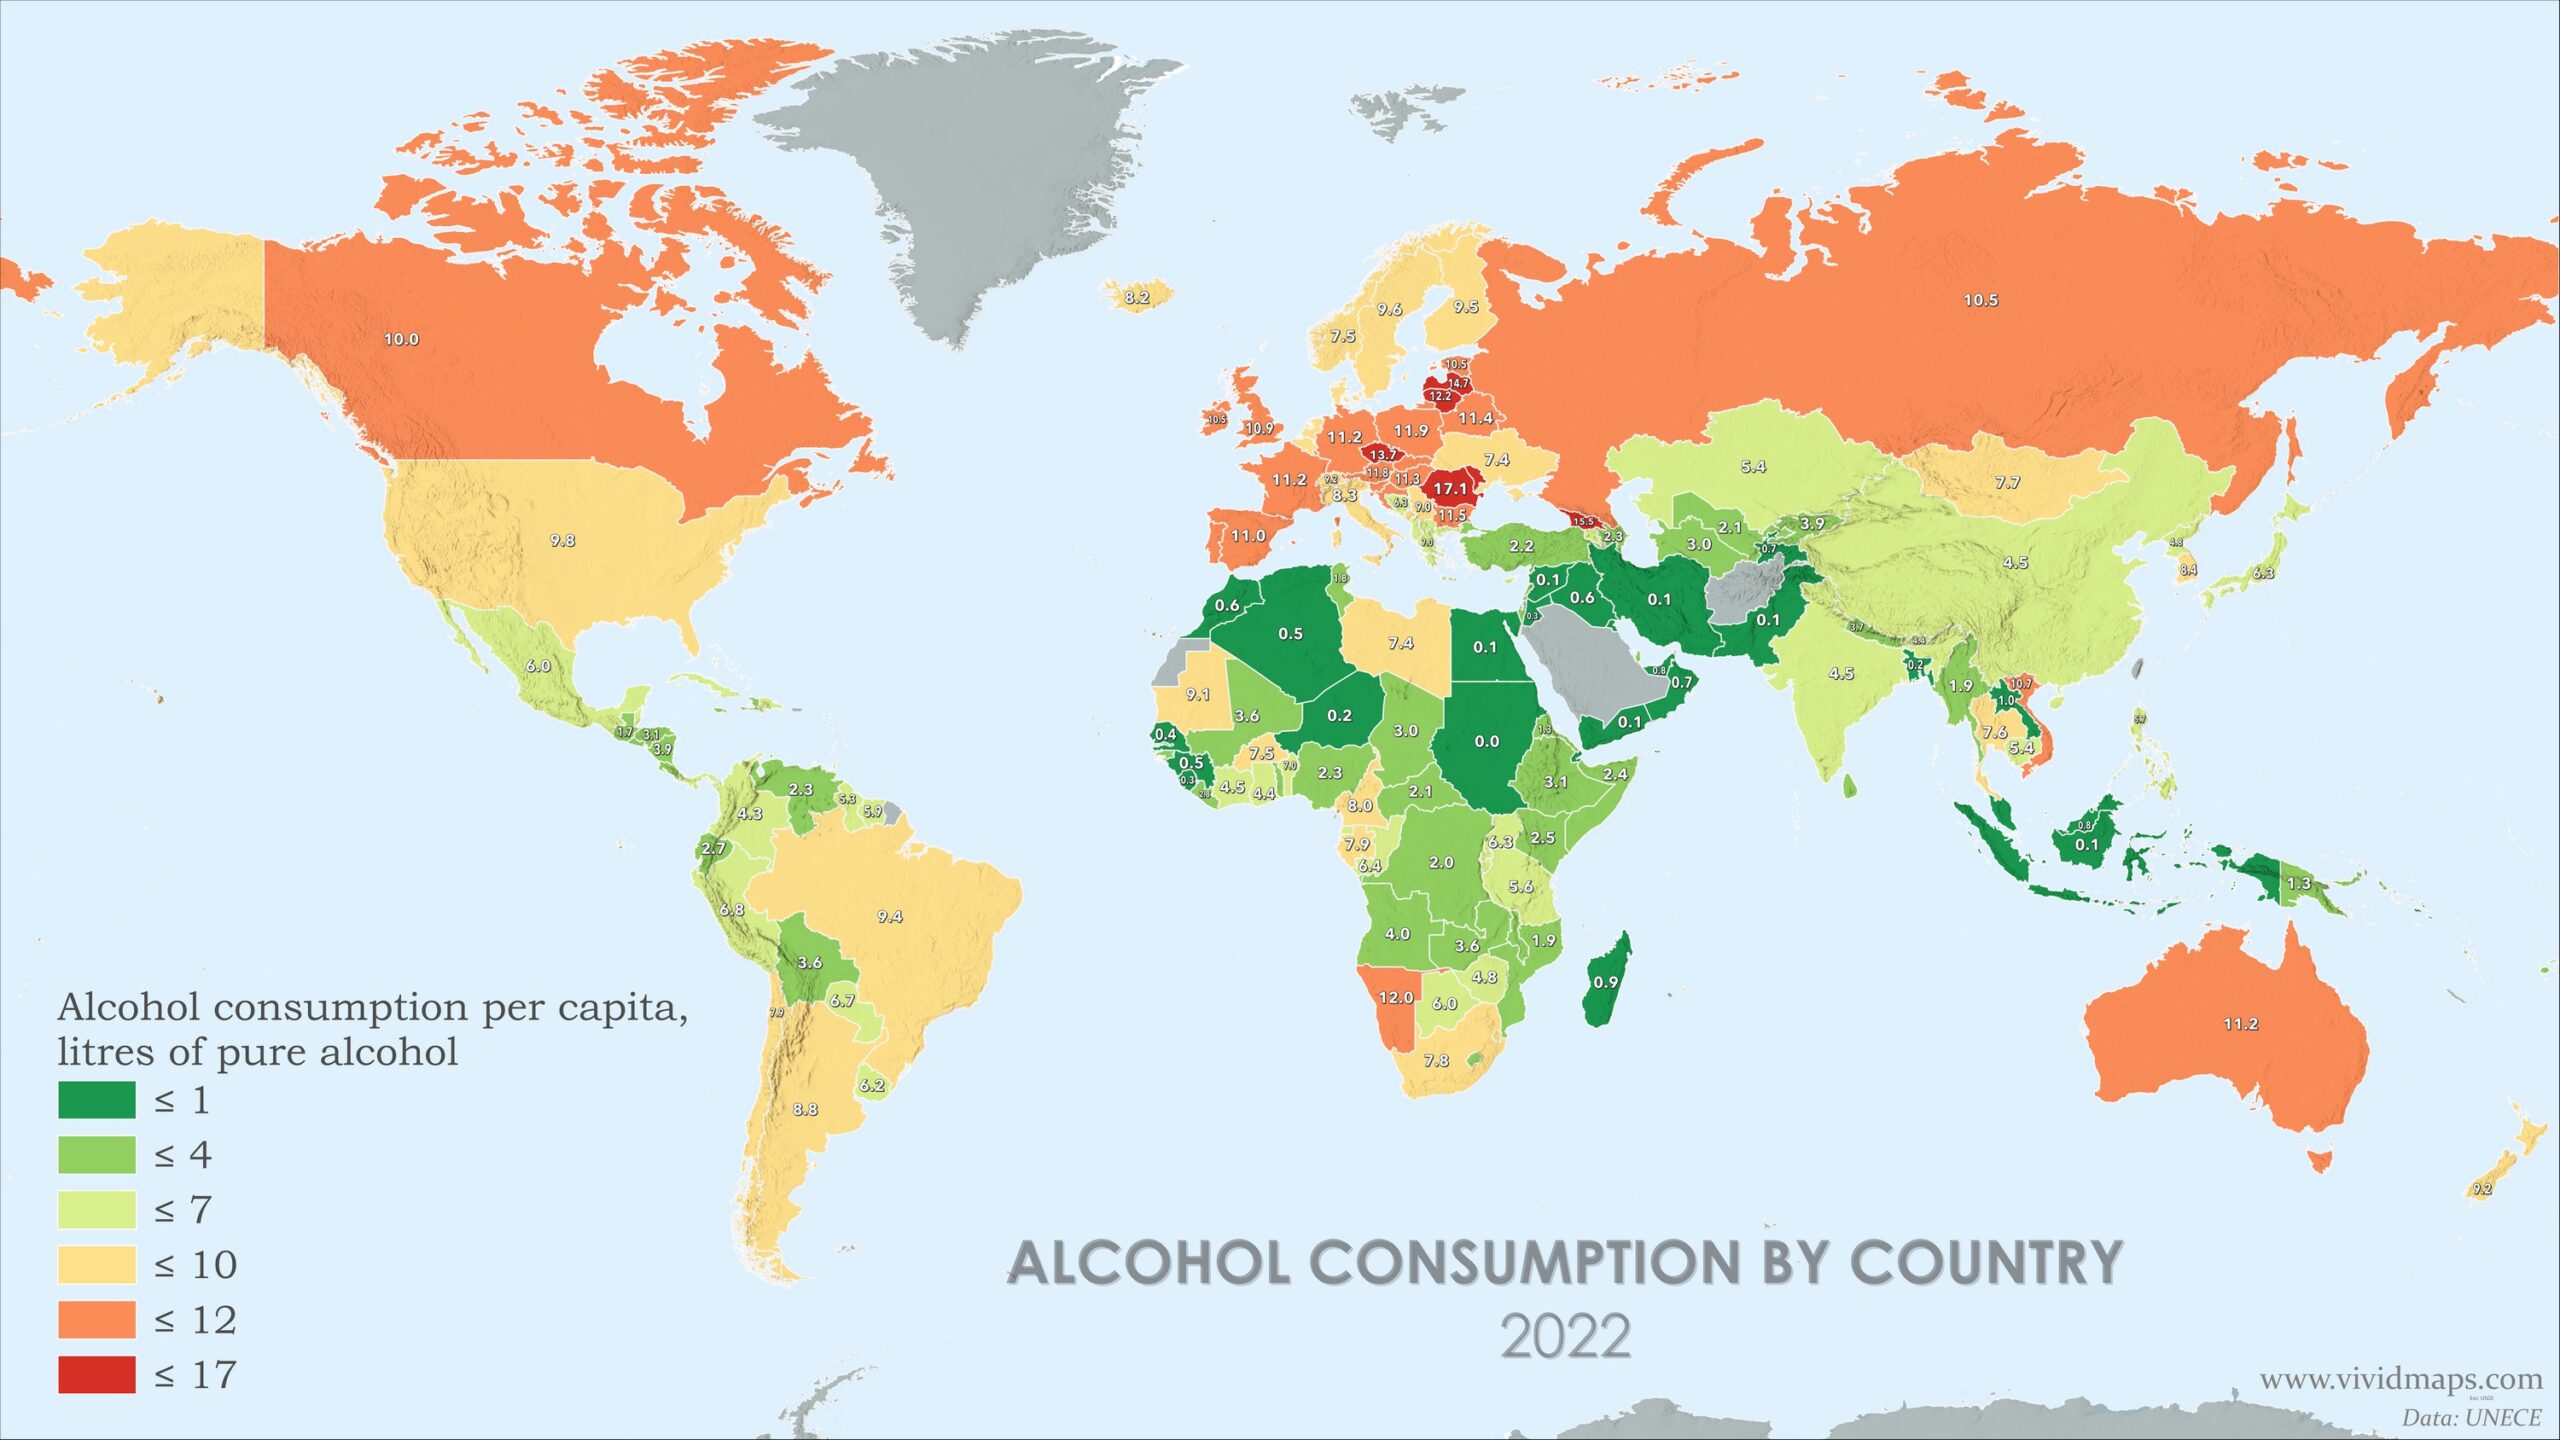
I pulled the UNECE SDG dataset covering the last ten years. The rankings shift around quite a bit. Some countries climb, some drop. Others barely move at all.
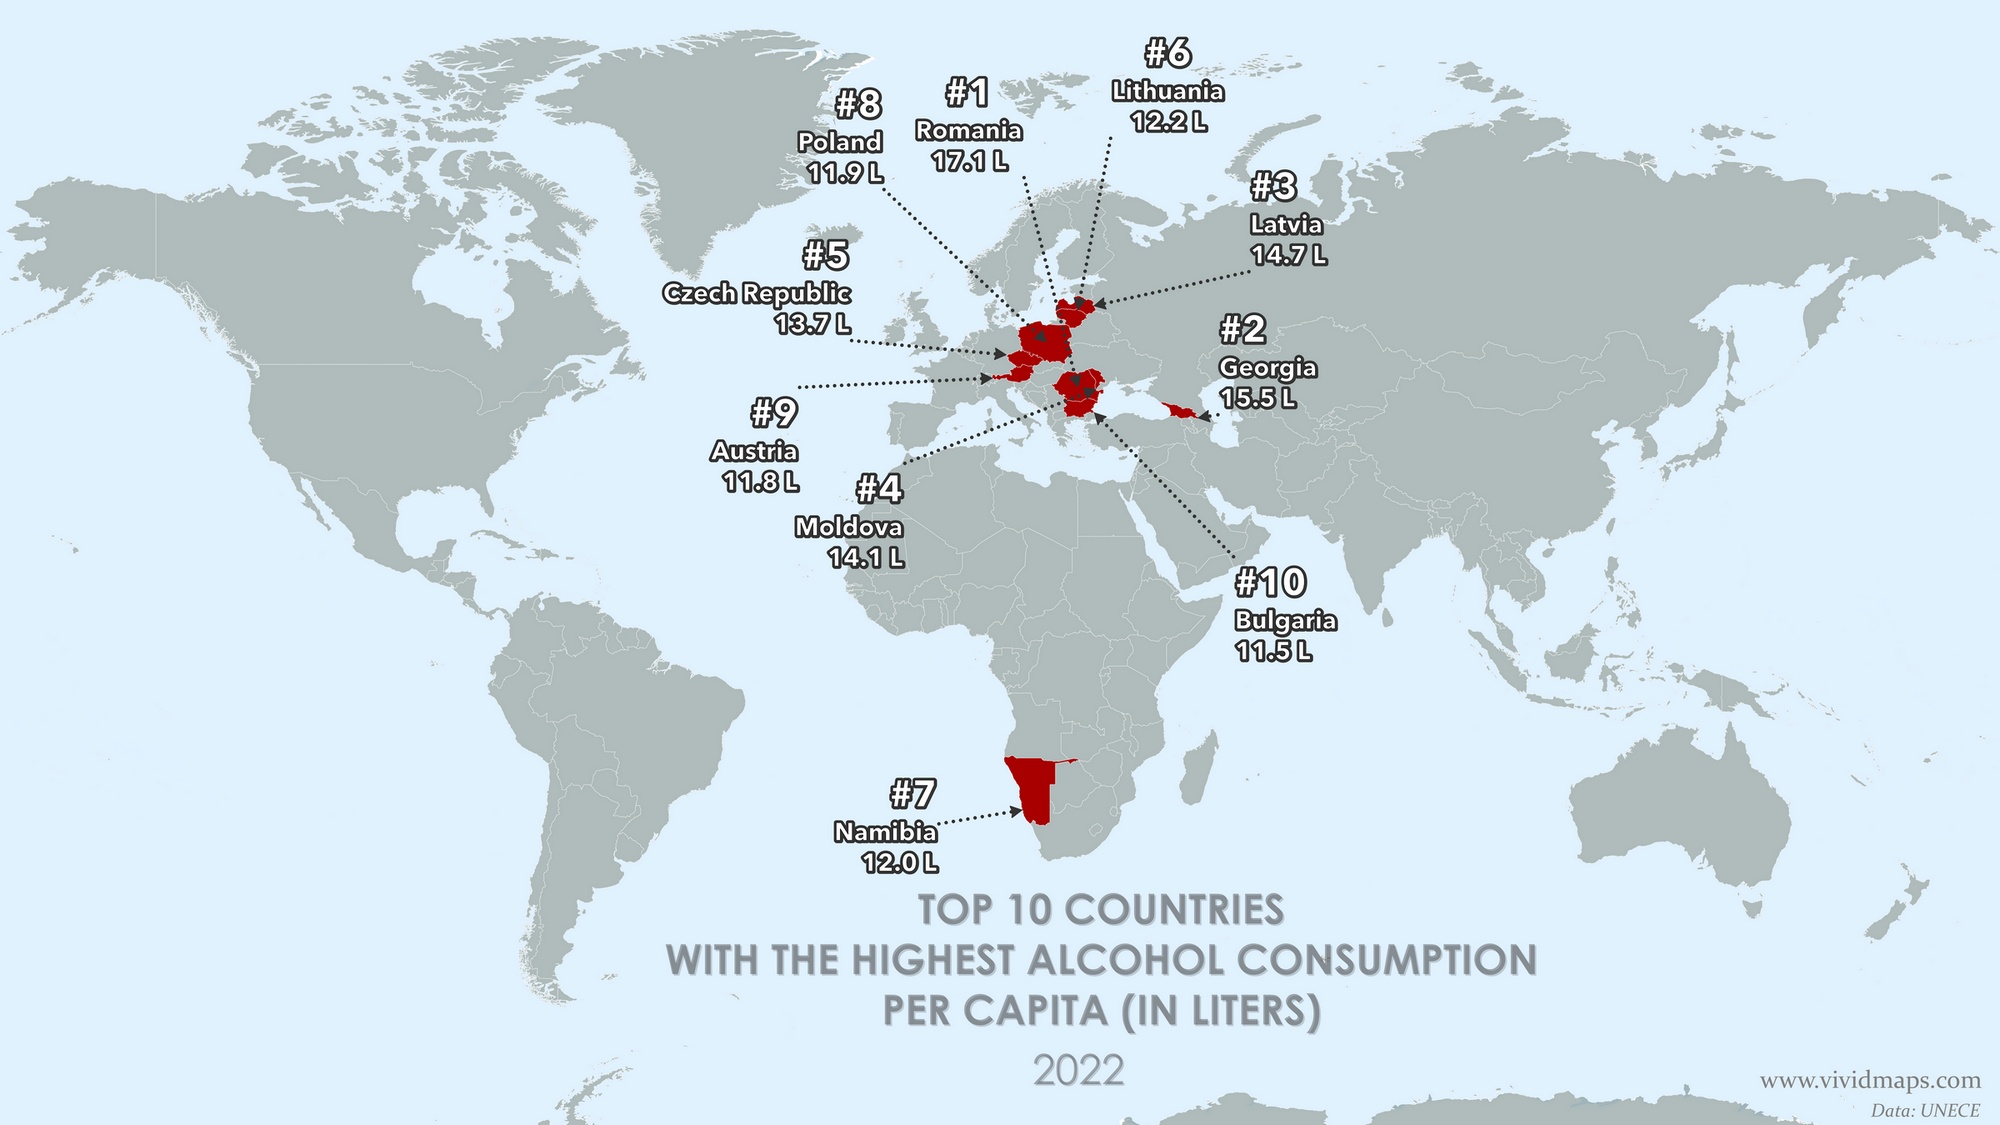
Romania leads the 2022 data at 17.1 litres per person. Remember, this is measuring the ethanol itself—not how much beer or wine you pour, just what’s actually alcohol. After Romania: Georgia at 15.5, Latvia at 14.7, Moldova at 14.1.

Tourism throws off the numbers for small countries. When millions of visitors show up and buy drinks, those purchases count toward total sales—but only residents count in the population denominator. Result: per-capita figures that look absurdly high but reflect tourists as much as locals.
If you’re looking at places like Andorra or the Seychelles, keep in mind visitors can outnumber residents by huge margins. Those high consumption numbers include a lot of vacation drinking.

There’s also all the alcohol that governments never count. Homemade wine, backyard stills, bottles traded under the table – this stuff is everywhere but doesn’t show up in official statistics. In certain countries it’s actually most of what people drink.
Per-person consumption worldwide has been trending down since around 2010. Looking at individual countries, though, you see all kinds of movement.
Price matters most. Raise alcohol taxes and consumption drops. There’s solid research showing this works pretty much everywhere you try it.
Then COVID hit and flipped everything around. Bars shut down, so people started buying bottles to drink at home instead. OECD data shows retail alcohol sales jumped while restaurant/bar sales tanked. Some of that stuck even after things reopened.
The countries leading the 2022 rankings got there for reasons: established drinking cultures, local production keeping prices down, tax policies that don’t discourage alcohol much, social norms where drinking is just what you do.
The UNECE data allow you to compare how alcohol consumption changed in countries throughout time.
country | Alcohol Consumption Per Capita, 2020 | Alcohol Consumption Per Capita, 2021 | Alcohol Consumption Per Capita, 2022 |
---|---|---|---|
Romania | 17.1 | 17.1 | 17.1 |
Georgia | 15.9 | 15.5 | 15.5 |
Latvia | 14.7 | 14.7 | 14.7 |
Moldova | 13.4 | 14.1 | 14.1 |
Czech Republic | 13.6 | 13.7 | 13.7 |
Lithuania | 12 | 12.2 | 12.2 |
Namibia | 11.8 | 12 | 12 |
Poland | 12.1 | 11.9 | 11.9 |
Austria | 11.9 | 11.8 | 11.8 |
Bulgaria | 11.4 | 11.5 | 11.5 |
Belarus | 11.2 | 11.4 | 11.4 |
Saint Lucia | 11.4 | 11.4 | 11.4 |
Seychelles | 11.7 | 11.4 | 11.4 |
Hungary | 11.3 | 11.3 | 11.3 |
Germany | 11.3 | 11.2 | 11.2 |
France | 11.4 | 11.2 | 11.2 |
Australia | 11 | 11.2 | 11.2 |
Portugal | 10.9 | 11.2 | 11.2 |
Andorra | 11 | 11.1 | 11.1 |
Spain | 10.7 | 11 | 11 |
Slovakia | 11.1 | 11 | 11 |
United Kingdom | 10.8 | 10.9 | 10.9 |
Slovenia | 11.3 | 10.9 | 10.9 |
Croatia | 10.8 | 10.8 | 10.8 |
Luxembourg | 11 | 10.8 | 10.8 |
Vietnam | 10.6 | 10.7 | 10.7 |
Russia | 10.6 | 10.5 | 10.5 |
Ireland | 10.6 | 10.5 | 10.5 |
Estonia | 9.7 | 10.5 | 10.5 |
Canada | 10.1 | 10 | 10 |
Denmark | 9.9 | 10 | 10 |
United States | 9.7 | 9.8 | 9.8 |
Sweden | 9.5 | 9.6 | 9.6 |
Finland | 9.8 | 9.5 | 9.5 |
Barbados | 9.6 | 9.5 | 9.5 |
Brazil | 9.5 | 9.4 | 9.4 |
Antigua and Barbuda | 9.8 | 9.4 | 9.4 |
Switzerland | 9.3 | 9.2 | 9.2 |
New Zealand | 9.3 | 9.2 | 9.2 |
Serbia | 9.1 | 9 | 9 |
Argentina | 8.2 | 8.8 | 8.8 |
Netherlands | 8.7 | 8.7 | 8.7 |
Belgium | 9.2 | 8.7 | 8.7 |
South Korea | 8.5 | 8.4 | 8.4 |
Italy | 8.3 | 8.3 | 8.3 |
Iceland | 8 | 8.2 | 8.2 |
Cameroon | 8 | 8 | 8 |
Montenegro | 8.3 | 8 | 8 |
Chile | 7.9 | 7.9 | 7.9 |
Gabon | 7.5 | 7.9 | 7.9 |
South Africa | 7.8 | 7.8 | 7.8 |
Grenada | 7.9 | 7.8 | 7.8 |
Mongolia | 7.8 | 7.7 | 7.7 |
Mauritius | 7.8 | 7.7 | 7.7 |
Thailand | 7.7 | 7.6 | 7.6 |
Burkina Faso | 7.5 | 7.5 | 7.5 |
Norway | 7.4 | 7.5 | 7.5 |
Ukraine | 8.4 | 7.4 | 7.4 |
Eswatini | 7.1 | 7.2 | 7.2 |
Benin | 7 | 7 | 7 |
Greece | 7 | 7 | 7 |
Dominica | 7.1 | 7 | 7 |
Saint Kitts and Nevis | 7.9 | 7 | 7 |
Bahamas | 6.9 | 6.9 | 6.9 |
Peru | 7 | 6.8 | 6.8 |
Saint Vincent and the Grenadines | 6.9 | 6.8 | 6.8 |
Paraguay | 6.5 | 6.7 | 6.7 |
Rwanda | 6.3 | 6.5 | 6.5 |
Republic of the Congo | 6.3 | 6.4 | 6.4 |
Japan | 6.4 | 6.3 | 6.3 |
Uganda | 6.4 | 6.3 | 6.3 |
Panama | 6.3 | 6.3 | 6.3 |
Bosnia and Herzegovina | 6.2 | 6.3 | 6.3 |
Uruguay | 6.2 | 6.2 | 6.2 |
Malta | 6.5 | 6.2 | 6.2 |
Equatorial Guinea | 6.3 | 6.1 | 6.1 |
Mexico | 5.9 | 6 | 6 |
Botswana | 6.1 | 6 | 6 |
Suriname | 6.1 | 5.9 | 5.9 |
North Macedonia | 5.8 | 5.8 | 5.8 |
Philippines | 5.8 | 5.7 | 5.7 |
Sao Tome and Principe | 5.9 | 5.7 | 5.7 |
Tanzania | 5.5 | 5.6 | 5.6 |
Cuba | 5.8 | 5.6 | 5.6 |
Kazakhstan | 4.7 | 5.4 | 5.4 |
Cambodia | 5.7 | 5.4 | 5.4 |
Zimbabwe | 5.6 | 5.4 | 5.4 |
Guyana | 5.1 | 5.3 | 5.3 |
Dominican Republic | 5.1 | 5.2 | 5.2 |
Cyprus | 5.4 | 5.2 | 5.2 |
Belize | 5.4 | 5.1 | 5.1 |
Albania | 4.9 | 5 | 5 |
North Korea | 4.3 | 4.8 | 4.8 |
Trinidad and Tobago | 4.7 | 4.8 | 4.8 |
India | 4.5 | 4.5 | 4.5 |
China | 4.8 | 4.5 | 4.5 |
Ivory Coast | 4.4 | 4.5 | 4.5 |
Burundi | 4.4 | 4.5 | 4.5 |
Ghana | 4.6 | 4.4 | 4.4 |
Bhutan | 4.4 | 4.4 | 4.4 |
Colombia | 4.1 | 4.3 | 4.3 |
Armenia | 4.7 | 4.3 | 4.3 |
Angola | 4.5 | 4 | 4 |
Kyrgyzstan | 4.1 | 3.9 | 3.9 |
Nicaragua | 3.9 | 3.9 | 3.9 |
Jamaica | 3.8 | 3.9 | 3.9 |
Costa Rica | 3.6 | 3.8 | 3.8 |
Lesotho | 3.9 | 3.8 | 3.8 |
Cape Verde | 4.1 | 3.8 | 3.8 |
Nepal | 3.2 | 3.7 | 3.7 |
Mali | 2.7 | 3.6 | 3.6 |
Zambia | 3.6 | 3.6 | 3.6 |
Bolivia | 3.6 | 3.6 | 3.6 |
Fiji | 3.7 | 3.5 | 3.5 |
El Salvador | 3.4 | 3.4 | 3.4 |
Haiti | 3.3 | 3.3 | 3.3 |
Niue | 3 | 3.3 | 3.3 |
Guinea-Bissau | 3.2 | 3.2 | 3.2 |
Ethiopia | 3.3 | 3.1 | 3.1 |
Honduras | 3.2 | 3.1 | 3.1 |
Israel | 3.1 | 3.1 | 3.1 |
Chad | 3.1 | 3 | 3 |
Turkmenistan | 3 | 3 | 3 |
Nauru | 2.8 | 3 | 3 |
Samoa | 2.9 | 2.9 | 2.9 |
Liberia | 3 | 2.8 | 2.8 |
Sri Lanka | 2.7 | 2.7 | 2.7 |
Ecuador | 2.8 | 2.7 | 2.7 |
Kenya | 2.8 | 2.5 | 2.5 |
Nigeria | 2.2 | 2.3 | 2.3 |
Venezuela | 2.3 | 2.3 | 2.3 |
Azerbaijan | 2.4 | 2.3 | 2.3 |
Turkey | 2.1 | 2.2 | 2.2 |
Uzbekistan | 2.3 | 2.1 | 2.1 |
Central African Republic | 2.1 | 2.1 | 2.1 |
DR Congo | 2 | 2 | 2 |
Singapore | 1.8 | 2 | 2 |
Micronesia | 2 | 2 | 2 |
Myanmar | 2.1 | 1.9 | 1.9 |
Mozambique | 2 | 1.9 | 1.9 |
Vanuatu | 2.2 | 1.9 | 1.9 |
Tunisia | 1.9 | 1.8 | 1.8 |
Malawi | 1.5 | 1.7 | 1.7 |
Guatemala | 1.7 | 1.7 | 1.7 |
Bahrain | 1.7 | 1.7 | 1.7 |
Lebanon | 1.6 | 1.6 | 1.6 |
Maldives | 1.8 | 1.6 | 1.6 |
Papua New Guinea | 1.4 | 1.3 | 1.3 |
Eritrea | 1.3 | 1.3 | 1.3 |
Qatar | 1.2 | 1.3 | 1.3 |
Togo | 1.2 | 1.2 | 1.2 |
Laos | 11.2 | 11.2 | 1 |
Kiribati | 1.1 | 1 | 1 |
Madagascar | 0.9 | 0.9 | 0.9 |
Malaysia | 0.8 | 0.8 | 0.8 |
South Sudan | 0.8 | 0.8 | 0.8 |
United Arab Emirates | 1.3 | 0.8 | 0.8 |
Solomon Islands | 0.8 | 0.8 | 0.8 |
Tajikistan | 0.8 | 0.7 | 0.7 |
Oman | 0.8 | 0.7 | 0.7 |
Brunei | 0.7 | 0.7 | 0.7 |
Iraq | 0.6 | 0.6 | 0.6 |
Morocco | 0.6 | 0.6 | 0.6 |
Gambia | 0.7 | 0.6 | 0.6 |
Algeria | 0.5 | 0.5 | 0.5 |
Guinea | 0.5 | 0.5 | 0.5 |
Senegal | 0.4 | 0.4 | 0.4 |
Djibouti | 0.3 | 0.4 | 0.4 |
Comoros | 0.4 | 0.4 | 0.4 |
Jordan | 0.3 | 0.3 | 0.3 |
Sierra Leone | 0.3 | 0.3 | 0.3 |
Tonga | 0.3 | 0.3 | 0.3 |
Tuvalu | 0.3 | 0.3 | 0.3 |
Niger | 0.1 | 0.2 | 0.2 |
Timor-Leste | 0.2 | 0.2 | 0.2 |
Indonesia | 0.1 | 0.1 | 0.1 |
Pakistan | 0.1 | 0.1 | 0.1 |
Egypt | 0.1 | 0.1 | 0.1 |
Iran | 0.1 | 0.1 | 0.1 |
Syria | 0.1 | 0.1 | 0.1 |
Kuwait | 0.1 | 0.1 | 0.1 |
Warning: If you drink heavily and often, you’re doing real damage. Liver disease, cancer (multiple types), heart problems, mental health issues, plus a higher chance of accidents and injuries. The WHO is clear: there’s no safe amount when it comes to cancer risk. Drinking less means less risk.