Alcohol consumption in the United States
In the past two decades, alcohol consumption in the U.S. has risen to reach 2.35 gallons (8.9 liters) of ethanol per capita. Beer remains the most favored alcoholic beverage in the United States.
Understanding alcohol consumption patterns across the United States can provide insights into cultural, social, and health-related aspects of American life. Using various maps, we can explore how alcohol consumption varies by state and county, highlighting some intriguing trends and facts.
The U.S. states that drink the most alcohol
The first map created by Vinepair shows the U.S. states that drink the most alcohol. Unsurprisingly, states with larger populations, such as California, Texas, and New York, top the list. However, when adjusted for per capita consumption, some states stand out more than others. New Hampshire, for example, has a notably high per capita alcohol consumption, largely due to its low alcohol taxes and proximity to states with higher taxes, leading to cross-border purchasing.

According to the National Institute on Alcohol Abuse and Alcoholism (NIH), New Hampshire residents consume the most alcohol (4.76 gallons per year). Controversy average Utah only drinks 1.34 gallons of alcohol per year.
The map below, created by prikhodkopo shows the percentage of adults reporting binge or heavy drinking by county.
Percentage of adults reporting binge or heavy drinking
Binge and heavy drinking are significant public health concerns. According to the map created by prikhodkopo depicting the percentage of adults reporting binge or heavy drinking, the Midwest and Northern states, particularly Wisconsin, North Dakota, and Montana, have some of the highest rates. This trend is often attributed to social and cultural factors, including the prominence of drinking in social activities and harsh winter climates that might encourage indoor activities centered around alcohol.

The maps below show the percentage of underage alcohol use and underage binge drinking by U.S. states.
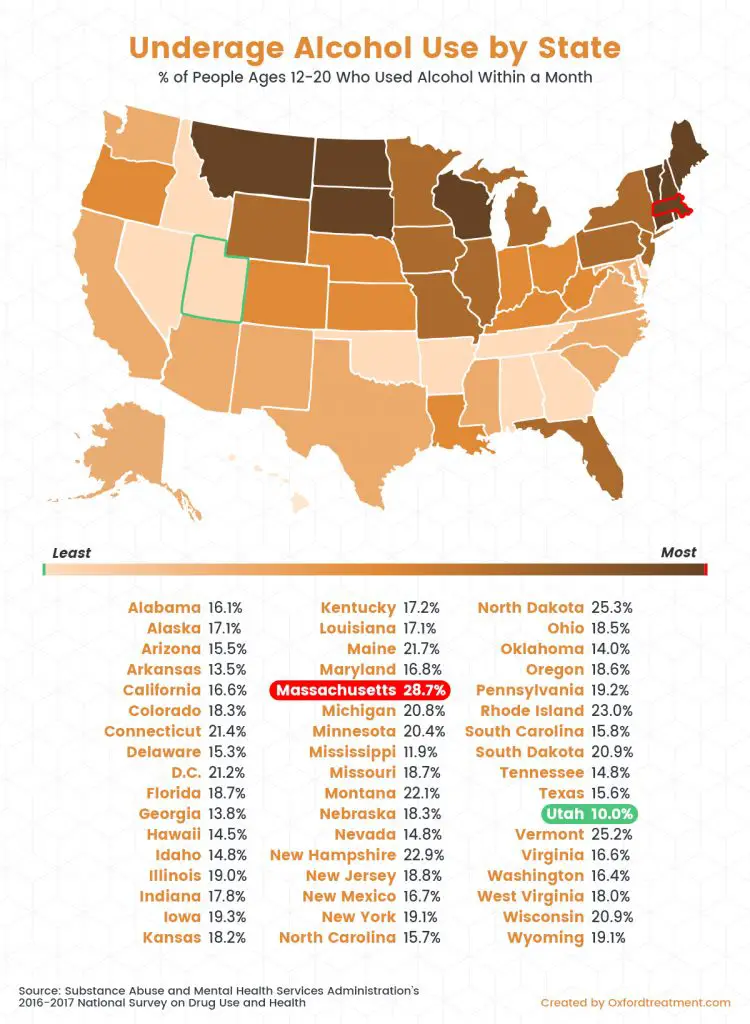
Underage Alcohol Drinking
Youth alcohol consumption is a critical issue, as early drinking can lead to long-term health problems and addiction. The map of the percentage of people ages 12-20 who used alcohol within a month reveals that states like Vermont and New Hampshire have higher rates of underage drinking. This could be related to the states’ smaller, more close-knit communities where youth might have easier access to alcohol.
Percentage of people ages 12-20 who used alcohol within a month
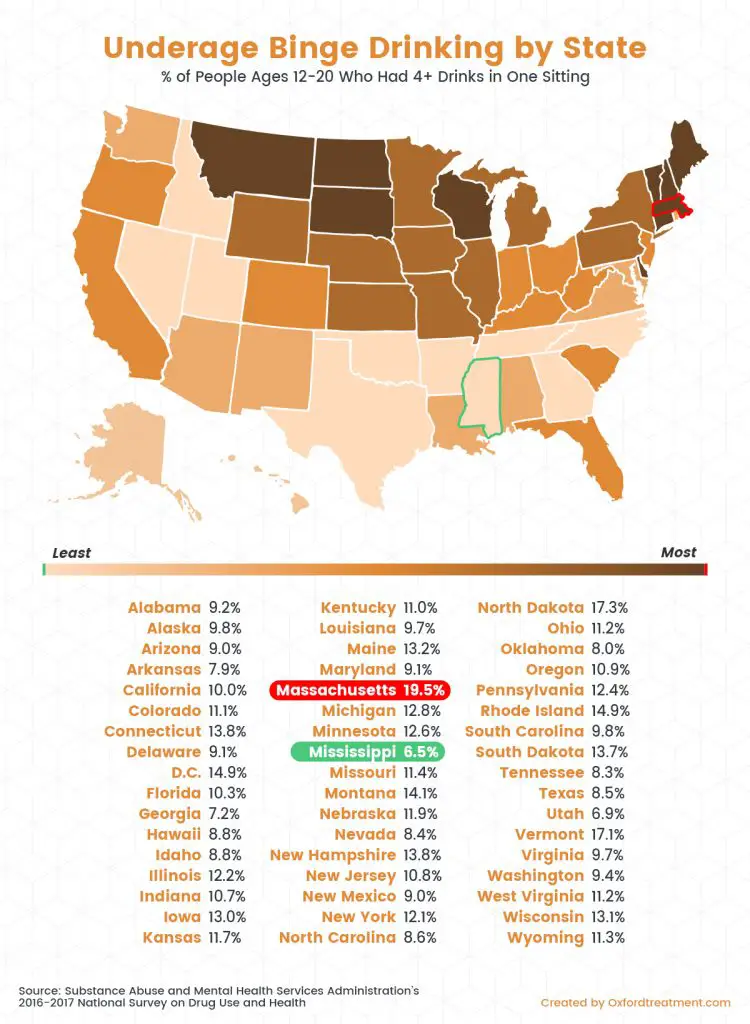
Even more concerning is the map created by oxfordtreatment.com showing the percentage of people ages 12-20 who had 4+ drinks in one sitting. States like North Dakota and South Dakota have alarming rates of youth binge drinking, which can lead to dangerous behaviors and long-term health issues. This highlights the need for targeted education and intervention programs in these areas.
Percentage of people ages 12-20 who had 4+ drinks in one sitting
Alcohol Use and Binge Drinking of People Ages 12-20 Within One Month (#’s in Thousands)
| STATE OR REGION | ALCOHOL USE | ALCOHOL USE % | AVG # OF EVERY DAY UNDERAGE DRINKERS | BINGE DRINKING | BINGE DRINKING % | AVG # OF EVERY DAY UNDERAGE BINGE DRINKERS |
|---|---|---|---|---|---|---|
| Alabama | 110 | 16.1% | 3.7 | 64 | 9.2% | 2.1 |
| Alaska | 17 | 17.1% | 0.6 | 10 | 9.8% | 0.3 |
| Arizona | 147 | 15.5% | 4.9 | 89 | 9.0% | 3.0 |
| Arkansas | 55 | 13.5% | 1.8 | 34 | 7.9% | 1.1 |
| California | 845 | 16.6% | 28.2 | 527 | 10.0% | 17.6 |
| Colorado | 135 | 18.3% | 4.5 | 84 | 11.1% | 2.8 |
| Connecticut | 100 | 21.4% | 3.3 | 66 | 13.8% | 2.2 |
| Delaware | 18 | 15.3% | 0.6 | 11 | 9.1% | 0.4 |
| D.C. | 14 | 21.2% | 0.5 | 10 | 14.9% | 0.3 |
| Florida | 436 | 18.7% | 14.5 | 246 | 10.3% | 8.2 |
| Georgia | 197 | 13.8% | 6.6 | 105 | 7.2% | 3.5 |
| Hawaii | 23 | 14.5% | 0.8 | 14 | 8.8% | 0.5 |
| Idaho | 36 | 14.8% | 1.2 | 22 | 8.8% | 0.7 |
| Illinois | 315 | 19.0% | 10.5 | 208 | 12.2% | 6.9 |
| Indiana | 164 | 17.8% | 5.5 | 101 | 10.7% | 3.4 |
| Iowa | 80 | 19.3% | 2.7 | 55 | 13.0% | 1.8 |
| Kansas | 76 | 18.2% | 2.5 | 50 | 11.7% | 1.7 |
| Kentucky | 103 | 17.2% | 3.4 | 68 | 11.0% | 2.3 |
| Louisiana | 105 | 17.1% | 3.5 | 61 | 9.7% | 2.0 |
| Maine | 34 | 21.7% | 1.1 | 21 | 13.2% | 0.7 |
| Maryland | 126 | 16.8% | 4.2 | 71 | 9.1% | 2.4 |
| Massachusetts | 281 | 28.7% | 9.4 | 196 | 19.5% | 6.5 |
| Michigan | 269 | 20.8% | 9.0 | 169 | 12.8% | 5.6 |
| Minnesota | 149 | 20.4% | 5.0 | 95 | 12.6% | 3.2 |
| Mississippi | 50 | 11.9% | 1.7 | 28 | 6.5% | 0.9 |
| Missouri | 152 | 18.7% | 5.1 | 96 | 11.4% | 3.2 |
| Montana | 28 | 22.1% | 0.9 | 18 | 14.1% | 0.6 |
| Nebraska | 48 | 18.3% | 1.6 | 32 | 11.9% | 1.1 |
| Nevada | 57 | 14.8% | 1.9 | 33 | 8.4% | 1.1 |
| New Hampshire | 38 | 22.9% | 1.3 | 23 | 13.8% | 0.8 |
| New Jersey | 212 | 18.8% | 7.1 | 125 | 10.8% | 4.2 |
| New Mexico | 46 | 16.7% | 1.5 | 25 | 9.0% | 0.8 |
| New York | 432 | 19.1% | 14.4 | 280 | 12.1% | 9.3 |
| North Carolina | 208 | 15.7% | 6.9 | 119 | 8.6% | 4.0 |
| North Dakota | 26 | 25.3% | 0.9 | 18 | 17.3% | 0.6 |
| Ohio | 271 | 18.5% | 9.0 | 168 | 11.2% | 5.6 |
| Oklahoma | 71 | 14.0% | 2.4 | 42 | 8.0% | 1.4 |
| Oregon | 91 | 18.6% | 3.0 | 55 | 10.9% | 1.8 |
| Pennsylvania | 292 | 19.2% | 9.7 | 194 | 12.4% | 6.5 |
| Rhode Island | 31 | 23.0% | 1.0 | 21 | 14.9% | 0.7 |
| South Carolina | 103 | 15.8% | 3.4 | 65 | 9.8% | 2.2 |
| South Dakota | 23 | 20.9% | 0.8 | 15 | 13.7% | 0.5 |
| Tennessee | 130 | 14.8% | 4.3 | 75 | 8.3% | 2.5 |
| Texas | 615 | 15.6% | 20.5 | 343 | 8.5% | 11.4 |
| Utah | 54 | 10.0% | 1.8 | 38 | 6.9% | 1.3 |
| Vermont | 18 | 25.2% | 0.6 | 13 | 17.1% | 0.4 |
| Virginia | 170 | 16.6% | 5.7 | 103 | 9.7% | 3.4 |
| Washington | 145 | 16.4% | 4.8 | 85 | 9.4% | 2.8 |
| West Virginia | 40 | 18.0% | 1.3 | 25 | 11.2% | 0.8 |
| Wisconsin | 155 | 20.9% | 5.2 | 100 | 13.1% | 3.3 |
| Wyoming | 15 | 19.1% | 0.5 | 9 | 11.3% | 0.3 |
| Total U.S. | 7,354 | 18.8% | 245 | 4,528 | 11.5% | 151 |
| Northeast | 1,438 | 22.0% | 48 | 938 | 14.1% | 31 |
| Midwest | 1,729 | 20.6% | 58 | 1,108 | 13.0% | 37 |
| South | 2,549 | 17.2% | 85 | 1,47 | 9.7% | 49 |
| West | 1,639 | 17.2% | 55 | 1,011 | 10.4% | 34 |
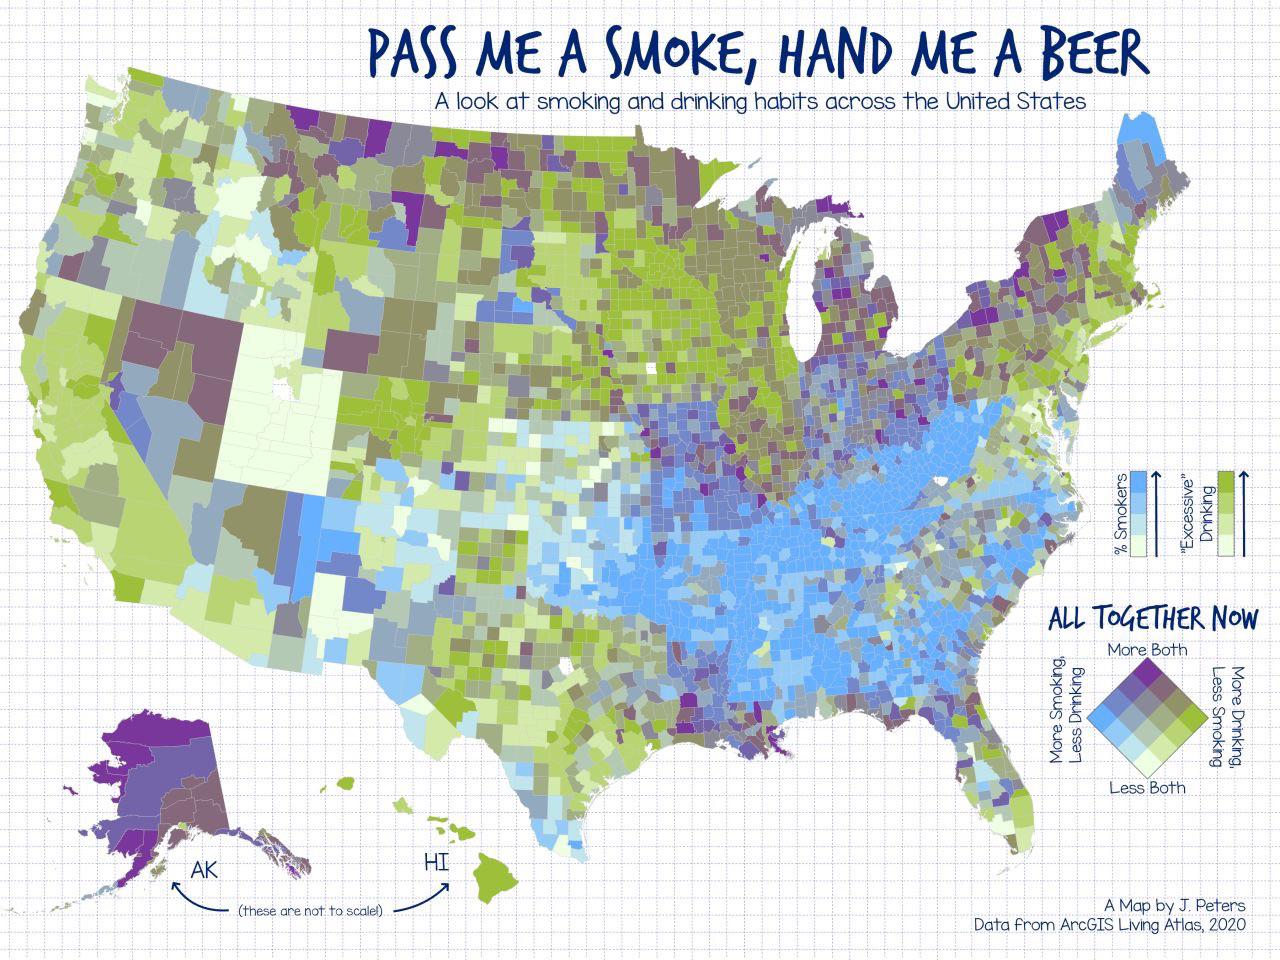
Drinking and Smoking by U.S. county
Alcohol consumption is also linked to other bad habits, such as smoking. The final map, created by J. Peters, focuses on drinking and smoking habits by U.S. county, providing a more granular view of substance use. It shows that counties in the Midwest and Appalachian regions have higher rates of both drinking and smoking. These patterns often correlate with socioeconomic factors, including lower income levels and higher unemployment rates, which can contribute to higher substance use as a coping mechanism.
Interesting Facts About Alcohol Consumption in the U.S.
- State Variability: New Hampshire has one of the highest per capita alcohol consumption rates in the U.S., despite its relatively small population. This is due in part to its lower alcohol taxes compared to neighboring states.
- Binge Drinking in the Midwest: The Midwest, particularly Wisconsin, is known for its high rates of binge drinking among adults. This region’s cultural and social norms often involve alcohol-centered activities.
- Youth Drinking Trends: Vermont and New Hampshire lead in underage drinking rates, indicating a need for stronger prevention and intervention efforts targeting youth in these states.
- Economic Correlation: Counties with higher poverty rates often see higher rates of both drinking and smoking, suggesting that economic stressors play a significant role in substance use patterns.
- Health Risks: Heavy drinking is linked to various health risks, including liver disease, cardiovascular problems, and increased risk of accidents and injuries. States with higher rates of heavy drinking often face greater public health challenges.
Conclusion
Analyzing alcohol consumption through these detailed maps offers a comprehensive understanding of how drinking behaviors vary across the United States. From the states that drink the most to the alarming rates of youth binge drinking, these insights can inform policies and programs aimed at reducing alcohol-related harm. By examining these trends, we can better address the social, economic, and health impacts of alcohol consumption across the country.
For more detailed visualizations, refer to the maps included in this analysis. These maps not only highlight regional differences but also underscore the need for targeted interventions and policies to address the complex issue of alcohol consumption in the United States.
Are you looking to learn more about alcohol abuse? Check out these recommended books.
- This Naked Mind: Control Alcohol, Find Freedom, Discover Happiness & Change Your Life
- Alcohol Explained
- Alcohol Lied to Me: The Intelligent Way to Escape Alcohol Addiction
- Sober On A Drunk Planet: Giving Up Alcohol. The Unexpected Shortcut to Finding Happiness, Health and Financial Freedom


