Diabetes is a chronic health disorder that affects how your body turns food into energy.
Most of the food you consume is split down into sugar and emitted into your bloodstream. When your blood sugar goes up, it signals your pancreas to discharge insulin. Insulin works like a key to letting the blood sugar into your body’s cells for usage as energy.
If you have diabetes, your body either doesn’t produce enough insulin or can’t utilize the insulin it makes as well as it should. Too much blood sugar remains in your bloodstream when there isn’t enough insulin, or cells stop reacting to insulin.
According to a CDC report, among the United States population overall (2018):
34.2 million people of all ages (0.5% of the U.S. population) had diabetes.
34.1 million adults aged 18 years or older (13.0% of all U.S. adults) had diabetes.
From 1999 to 2016, the age-adjusted prevalence of total diabetes was significantly raised among adults aged 18 years or older (prevalence estimations were 9.5% in 1999–2002 and 12.0% in 2013–2016).
7.3 million adults aged 18 years or older who met lab criteria for diabetes weren’t aware of or didn’t report having diabetes.
The percentage of adults with diabetes rose with age, reaching 26.8% among those aged 65 years or older.
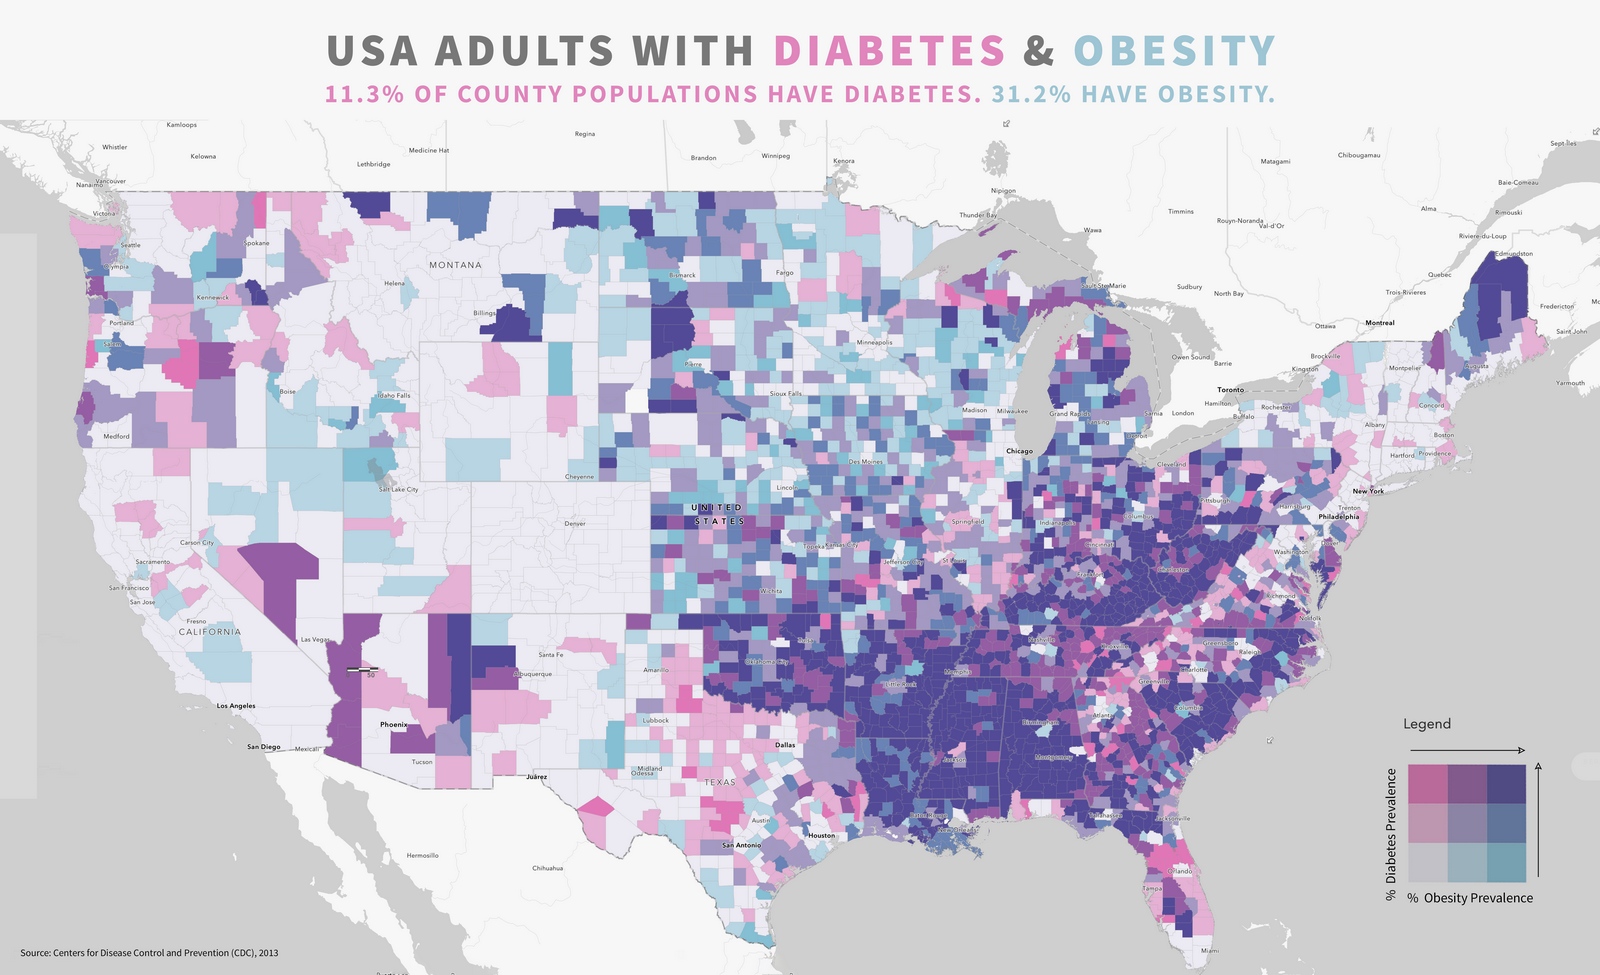
The highest rates of type 2 diabetes in the United States are in a “diabetes belt” in 15 mostly Southern U.S. states.
The map below illustrates the increase in the incidence of diabetes over time.
Smoking (21.6% were tobacco users based on self-report or levels of serum cotinine)
Overweight and Obesity (89.0% were overweight or had obesity, characterized as a body mass index (BMI) of 25 kg/m2 or higher)
Physical Inactivity (38.0% were physically passive)
The A1C test (50.0% had an A1C value of 7.0% or higher)
High Blood Pressure (68.4% had a systolic blood pressure of 140 mm Hg or higher or diastolic blood pressure of 90 mm Hg or higher or were on prescription medication for their high blood pressure)
High Cholesterol (43.5% had a non-HDL level of 130 mg/dL or higher)
The map below created by Reddit user kaixinsoh shows U.S. adults with diabetes and obesity.
")


")
 rated fast-food chains across the United States")