With the 2024 presidential election approaching, a new map created by Visual Capitalist, using data from the Federal Reserve Bank of St. Louis reveals an intriguing economic pattern across America’s political landscape. The data tells a story that goes beyond simple party lines, showing how household incomes vary dramatically between red, blue, and swing states.
The differences are clear: Democratic-leaning states generally show higher median household incomes, while Republican strongholds typically report lower earnings. But the story isn’t quite that simple.
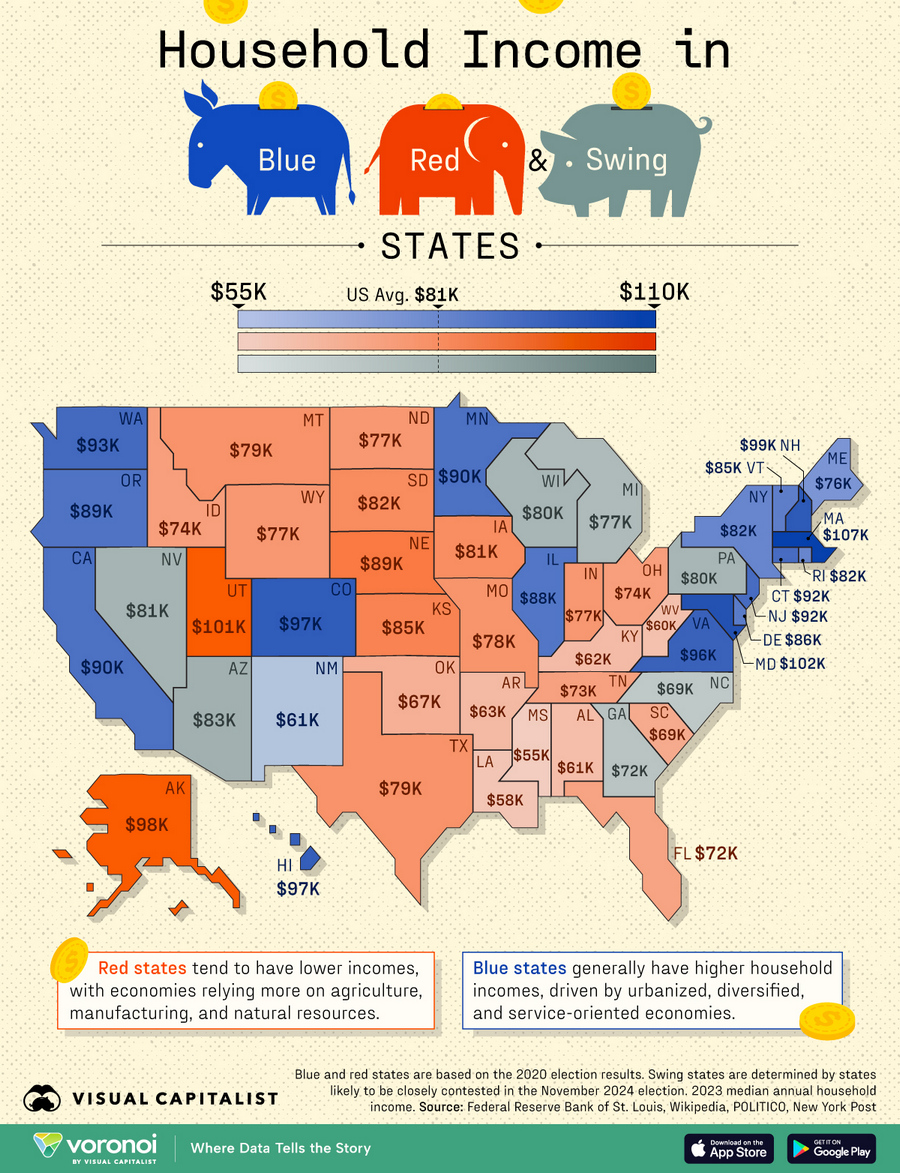
Take Massachusetts and Maryland, both consistently Democratic states, leading the pack with median household incomes of $107,000 and $102,000 respectively. What’s interesting is that Utah, a reliable Republican state, comes in third at $101,000 – breaking the expected pattern.
At the other end of the spectrum, the lowest incomes are found in Mississippi ($55,000), Louisiana ($58,000), and West Virginia ($60,000) – all traditionally Republican states. According to the Economic Policy Institute, these states’ economies heavily depend on traditional industries like agriculture, manufacturing, and natural resources.
The seven swing states that could determine the 2024 presidential election tell their own story:
Arizona: $83,000
Nevada: $81,000
Pennsylvania: $80,000
Wisconsin: $80,000
Michigan: $77,000
Georgia: $72,000
North Carolina: $69,000
What makes this data particularly relevant is its timing. According to the Brookings Institution, these swing states, home to diverse economic sectors, will likely play a crucial role in the upcoming election, with over 186 million Americans expected to vote.
The income variations reflect deeper economic realities. Blue states often feature more urbanized, service-oriented economies with strong technology and financial sectors. Meanwhile, red states frequently rely on traditional industries that, while vital to the nation’s economy, typically generate lower median incomes.
However, there are notable exceptions. New Mexico, despite being reliably Democratic, reports a lower median income of $61,000. Alaska and Utah, both Republican strongholds, boast some of the highest median incomes in the country.
Looking to display this fascinating data in your home or office? Here are some high-quality map options available on Amazon:


")