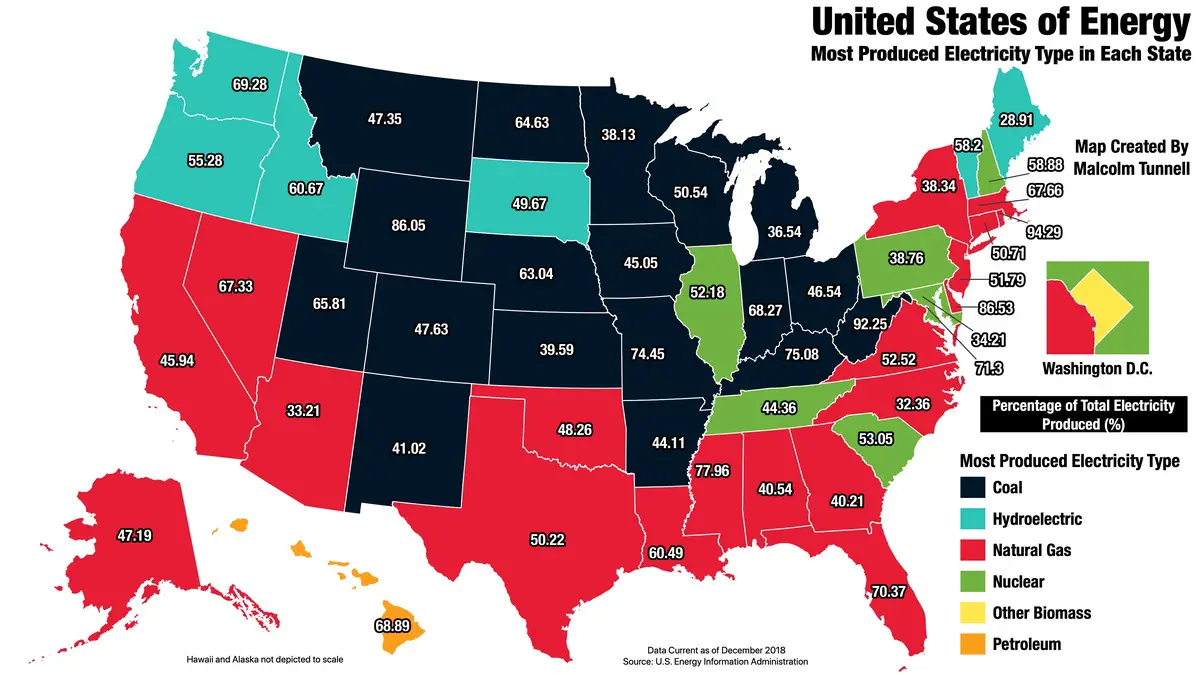
The map presents the largest electricity generation source by every state, along with what percentage of the total it represents as of 2018, according to U.S. Energy Information Administration 2018 Data. This map doesn’t look at consumption; it only concentrates on the production of energy.
The colours used in this map were explicitly taken to be both visually appealing and changed to be viewable by most colourblind people.
Most Produced Electricity Type in Each U.S. state
Reddit user: malxredleader
Below the numbers of U.S. states for each electricity type: Natural Gas: 19 Coal: 18 Nuclear: 6 Hydro: 6 Petroleum: 1 Other Biomass: 1
38.4% of the United States’ electricity comes from burning gas, 23.4% – from burning coal, 19.6% – from nuclear energy, 7.1% – from wind, 7.0% – from hydropower, 1.7% – from sun, 1.4% – from biomass, 0.4% – from burning petroleum, 0.4% – from geothermal energy.


")