All the World’s Roads Mapped
According to Nicolas de Loisy, the world has a total of 64,285,009 kilometers (39944853 miles)of roads of all types. There are 411,853 km (411854 mi) of expressways and 63,873,156 km (39,688,939) of normal roads, both paved and unpaved, that are currently in use.
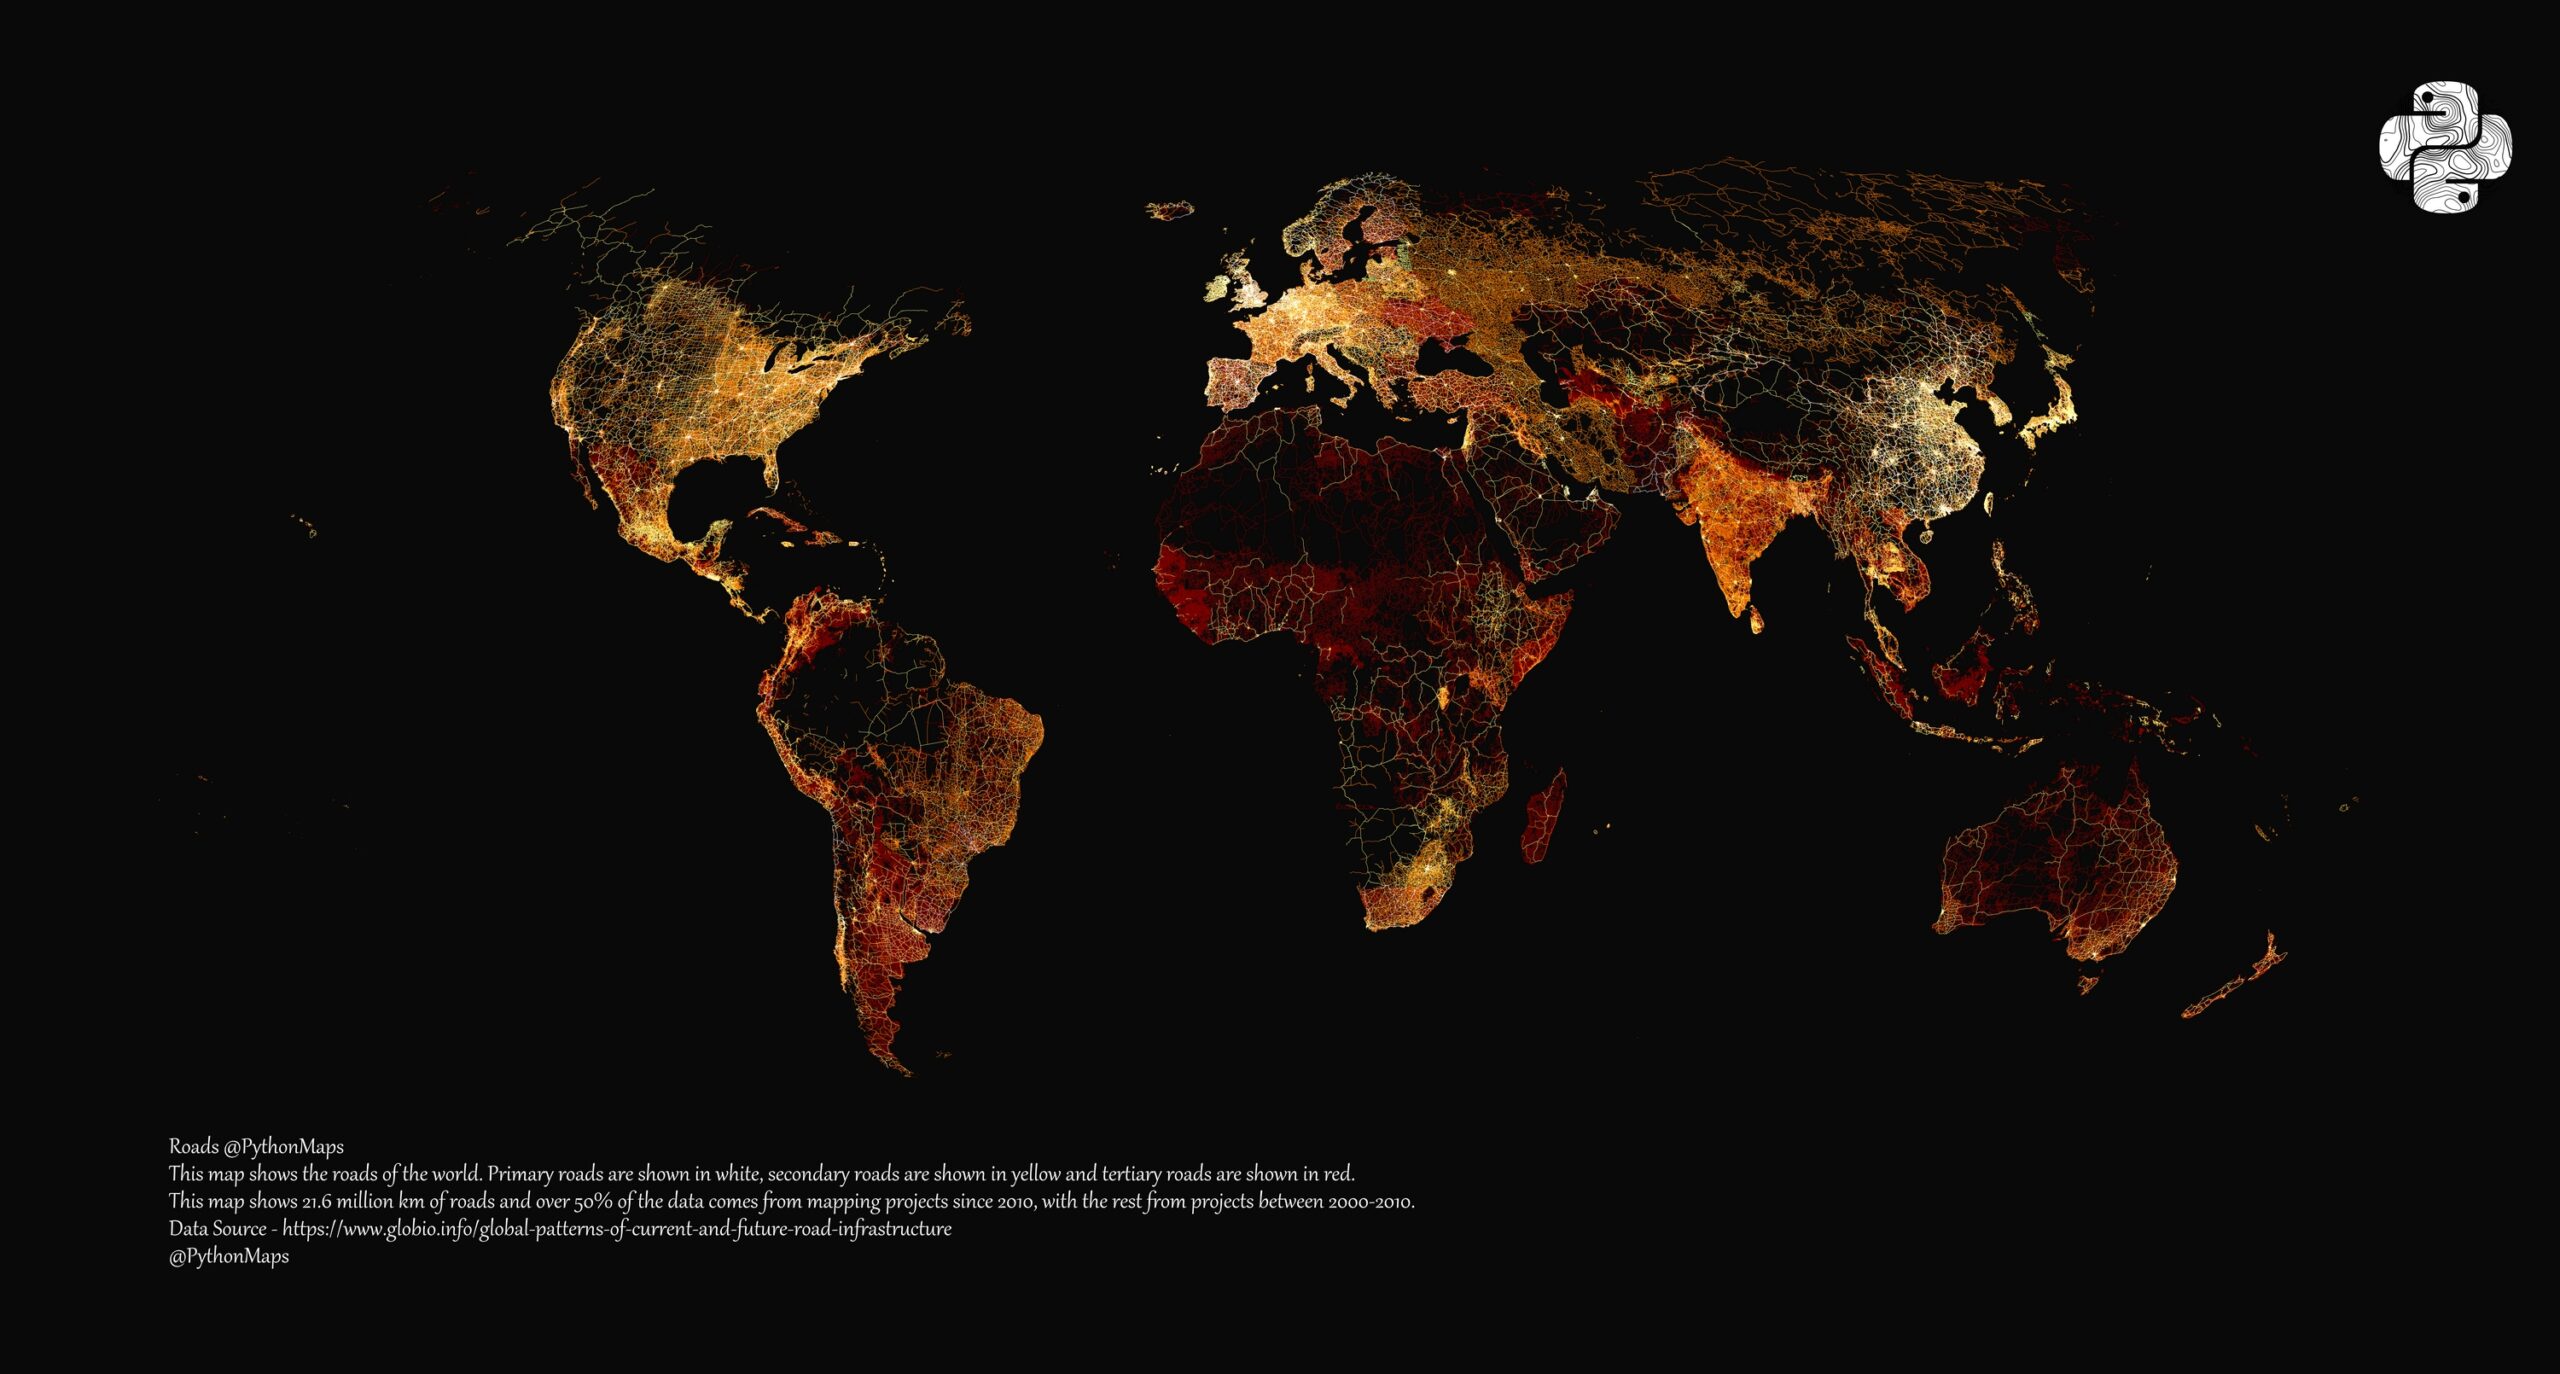
Visualizing roads is the best way to understand their size and reach. Adam Symington, a member of PythonMaps, utilized data from the Global Roads Inventory Project to chart the roads on a global scale. This resulted in a precise depiction of the human race’s desire for connectivity.
The Global Roads Inventory Project has classified all roads in their database using a UN classification system. To visualize this, the roads have been color-coded on the world map below using three different colors.
| Category | Definition | Color |
|---|---|---|
| Main Roads | Highways and primary roads between and within cities and towns. Multi-lane, limited entry, and exit points. | White |
| Secondary Roads | Paved, high-traffic, access between neighborhoods. | Yellow |
| Tertiary Roads | Paved or unpaved residential access within neighborhoods, or rural points of interest. | Red |
| Local Roads | All other smaller roads that don’t fit above, and usually are not throughfare. | Red |
The road network in the United States is the biggest in the world, covering almost 3 million kilometers (1.9 million miles). This is almost twice as much as China’s (1.7 million km or 1 million mi) and three times more than India’s (1 million km or 0.6 million mi).
According to the dataset, Norfolk Island has the smallest road network measuring only 10 kilometers or 6 miles.
However, if we categorize the road networks based on their type, the rankings undergo significant alterations.
China has surpassed the United States with almost twice as many main roads (highways + primary roads). Additionally, Japan and Canada have entered the top 10 list for the largest main road networks. However, India has fallen to the 8th position on the list.
More than 50% of the large road map in the United States is composed of local roads, totaling 1.8 million km in the database. This extensive network provides unparalleled accessibility throughout almost the entire country. The United States has the highest number of secondary roads in the world. Meanwhile, Argentina, India, and Australia are the top countries with the most tertiary roads.
| Rank | Country | All Roads, km | % of World's Roads | Main Roads, km | Secondary Roads, km | Tertiary Roads, km | Local Roads, km |
|---|---|---|---|---|---|---|---|
| 1 | U.S. | 3097278 | 14.34% | 3668 | 898873 | 42071 | 1789534 |
| 2 | China | 1709997 | 7.92% | 683248 | 306176 | 373831 | 346742 |
| 3 | India | 1052718 | 4.87% | 69748 | 41379 | 52613 | 4305 |
| 4 | Mexico | 741949 | 3.43% | 105822 | 181088 | 185587 | 269452 |
| 5 | Argentina | 703087 | 3.25% | 69188 | 55519 | 534876 | 43504 |
| 6 | Brazil | 681267 | 3.15% | 86772 | 223662 | 283933 | 869 |
| 7 | Russia | 621813 | 2.88% | 5292 | 512386 | 33742 | 22765 |
| 8 | Australia | 620393 | 2.87% | 69138 | 73376 | 426346 | 51533 |
| 9 | Germany | 563155 | 2.61% | 63517 | 97272 | 100513 | 301853 |
| 10 | France | 523566 | 2.42% | 74956 | 114433 | 192191 | 141986 |
| 11 | Japan | 45244 | 2.09% | 94451 | 67454 | 100536 | 189999 |
| 12 | Turkey | 448249 | 2.08% | 59013 | 40863 | 203987 | 144386 |
| 13 | Indonesia | 42997 | 1.99% | 29346 | 23324 | 334164 | 43136 |
| 14 | Colombia | 387471 | 1.79% | 20884 | 43084 | 309725 | 13778 |
| 15 | South Africa | 331909 | 1.54% | 56262 | 103332 | 138895 | 3342 |
| 16 | Kazakhstan | 30317 | 1.40% | 47393 | 41074 | 149963 | 6474 |
| 17 | Spain | 273597 | 1.27% | 64628 | 37571 | 80094 | 91304 |
| 18 | UK | 268709 | 1.24% | 63673 | 30999 | 48605 | 125432 |
| 19 | Thailand | 264639 | 1.23% | 45445 | 49924 | 129724 | 39546 |
| 20 | Italy | 263304 | 1.22% | 47098 | 51038 | 84147 | 81021 |
| 21 | Canada | 243155 | 1.13% | 91173 | 73525 | 46121 | 32336 |
| 22 | Ukraine | 22938 | 1.06% | 16342 | 33147 | 17002 | 9871 |
| 23 | Poland | 224904 | 1.04% | 20432 | 29499 | 67151 | 107822 |
| 24 | Turkmenistan | 2041 | 0.94% | 4731 | 24952 | 17441 | 7 |
| 25 | Peru | 203726 | 0.94% | 31361 | 47296 | 115038 | 10031 |
| 26 | Vietnam | 187599 | 0.87% | 138 | 17635 | 152901 | 3263 |
| 27 | Bangladesh | 183317 | 0.85% | 13272 | 21723 | 137497 | 10825 |
| 28 | Somalia | 163093 | 0.76% | 4605 | 32248 | 125418 | 822 |
| 29 | Dem. Rep. Congo | 162174 | 0.75% | 20209 | 29387 | 109962 | 2616 |
| 30 | Iran | 145177 | 0.67% | 23722 | 98687 | 5953 | 16815 |
| 31 | Iraq | 140365 | 0.65% | 12418 | 53285 | 71012 | 365 |
| 32 | Angola | 135627 | 0.63% | 6691 | 10588 | 11468 | 3668 |
| 33 | Sweden | 121673 | 0.56% | 20562 | 25438 | 45807 | 29866 |
| 34 | South Korea | 119456 | 0.55% | 3359 | 24399 | 20517 | 4095 |
| 35 | Venezuela | 118378 | 0.55% | 19663 | 13822 | 74656 | 10237 |
| 36 | Libya | 117504 | 0.54% | 7277 | 5615 | 80985 | 23627 |
| 37 | Bolivia | 108594 | 0.50% | 7957 | 8091 | 8296 | 9586 |
| 38 | Pakistan | 106183 | 0.49% | 19186 | 25672 | 55535 | 579 |
| 39 | Sudan | 101345 | 0.47% | 4859 | 5142 | 81954 | 939 |
| 40 | Guinea | 101324 | 0.47% | 486 | 8379 | 9032 | 2139 |
| 41 | New Zealand | 100404 | 0.46% | 12522 | 6913 | 64498 | 16471 |
| 42 | Philippines | 96466 | 0.45% | 17077 | 15267 | 42811 | 21311 |
| 43 | Sri Lanka | 96023 | 0.44% | 7704 | 15715 | 70536 | 2068 |
| 44 | Kenya | 94339 | 0.44% | 5792 | 28241 | 57725 | 2581 |
| 45 | Chile | 9303 | 0.43% | 21078 | 41353 | 20274 | 10325 |
| 46 | Nigeria | 92469 | 0.43% | 7545 | 8119 | 68572 | 8233 |
| 47 | Austria | 90284 | 0.42% | 13413 | 12878 | 1547 | 48523 |
| 48 | Finland | 89386 | 0.41% | 14847 | 1603 | 33043 | 25466 |
| 49 | Czech Republic | 89266 | 0.41% | 7877 | 15232 | 3564 | 30517 |
| 50 | Saudi Arabia | 86188 | 0.40% | 1686 | 802 | 45593 | 15715 |
| 51 | Greece | 86128 | 0.40% | 11533 | 12284 | 34815 | 27496 |
| 52 | Afghanistan | 83186 | 0.39% | 4189 | 2204 | 75762 | 1031 |
| 53 | Belarus | 80824 | 0.37% | 1772 | 29644 | 30928 | 2532 |
| 54 | Ecuador | 8029 | 0.37% | 5725 | 11034 | 55207 | 8324 |
| 55 | Myanmar | 79401 | 0.37% | 16527 | 13462 | 45041 | 4371 |
| 56 | Ethiopia | 79306 | 0.37% | 1992 | 22006 | 33409 | 3971 |
| 57 | Netherlands | 77793 | 0.36% | 11466 | 7425 | 1846 | 40442 |
| 58 | Senegal | 74928 | 0.35% | 2051 | 5437 | 64354 | 3086 |
| 59 | Taiwan | 7287 | 0.34% | 1144 | 8899 | 39987 | 12544 |
| 60 | Cameroon | 71882 | 0.33% | 1574 | 3453 | 64095 | 276 |
| 61 | Madagascar | 71341 | 0.33% | 2799 | 3779 | 63672 | 1091 |
| 62 | Zimbabwe | 70503 | 0.33% | 13482 | 18803 | 34883 | 3335 |
| 63 | Uruguay | 69587 | 0.32% | 10314 | 0 | 5916 | 113 |
| 64 | Norway | 66204 | 0.31% | 27175 | 19057 | 5377 | 14595 |
| 65 | Portugal | 65181 | 0.30% | 15545 | 9186 | 18646 | 21804 |
| 66 | Belgium | 65098 | 0.30% | 9048 | 7281 | 12661 | 36108 |
| 67 | Uzbekistan | 64445 | 0.30% | 16127 | 44 | 3557 | 761 |
| 68 | Romania | 63333 | 0.29% | 17127 | 18403 | 9745 | 18058 |
| 69 | Botswana | 6313 | 0.29% | 4979 | 8314 | 49837 | 0 |
| 70 | Mali | 59142 | 0.27% | 3432 | 308 | 48397 | 4233 |
| 71 | Mozambique | 58693 | 0.27% | 6686 | 23425 | 27266 | 1316 |
| 72 | Cuba | 56883 | 0.26% | 5373 | 6285 | 29485 | 1574 |
| 73 | Hungary | 56209 | 0.26% | 8732 | 11512 | 11819 | 24146 |
| 74 | Algeria | 55662 | 0.26% | 8675 | 6407 | 36187 | 4393 |
| 75 | Cambodia | 545 | 0.25% | 2231 | 11481 | 38387 | 2401 |
| 76 | Egypt | 5258 | 0.24% | 5872 | 5678 | 35611 | 5419 |
| 77 | Chad | 52257 | 0.24% | 304 | 1958 | 48767 | 1228 |
| 78 | Denmark | 50256 | 0.23% | 5053 | 6113 | 6556 | 32534 |
| 79 | Mauritania | 50056 | 0.23% | 1738 | 2185 | 45204 | 929 |
| 80 | Mongolia | 49873 | 0.23% | 9061 | 40812 | 0 | 0 |
| 81 | Switzerland | 46046 | 0.21% | 7278 | 5303 | 10821 | 22644 |
| 82 | Ivory Coast | 45807 | 0.21% | 703 | 7531 | 29015 | 2231 |
| 83 | Niger | 44638 | 0.21% | 2751 | 2099 | 38633 | 1155 |
| 84 | Bulgaria | 44225 | 0.20% | 409 | 4533 | 24534 | 11068 |
| 85 | Paraguay | 43298 | 0.20% | 5144 | 13669 | 21767 | 2718 |
| 86 | Yemen | 42476 | 0.20% | 6647 | 503 | 3402 | 1306 |
| 87 | Tanzania | 42 | 0.19% | 3852 | 4575 | 31734 | 1839 |
| 88 | North Korea | 41932 | 0.19% | 7338 | 7775 | 20167 | 6652 |
| 89 | Zambia | 40581 | 0.19% | 4648 | 3806 | 31113 | 1014 |
| 90 | Guatemala | 40413 | 0.19% | 2745 | 10431 | 20632 | 6605 |
| 91 | Namibia | 40131 | 0.19% | 2904 | 2146 | 35073 | 8 |
| 92 | Ireland | 3962 | 0.18% | 1754 | 0 | 15379 | 6701 |
| 93 | Morocco | 39479 | 0.18% | 4727 | 2424 | 28105 | 4223 |
| 94 | Papua New Guinea | 3796 | 0.18% | 562 | 7168 | 25172 | 0 |
| 95 | Malaysia | 37237 | 0.17% | 6022 | 16713 | 1402 | 482 |
| 96 | Nepal | 36791 | 0.17% | 1728 | 3644 | 301 | 1319 |
| 97 | Croatia | 3487 | 0.16% | 9844 | 11043 | 6506 | 7477 |
| 98 | Syria | 34433 | 0.16% | 644 | 6834 | 16624 | 4535 |
| 99 | Sierra Leone | 33559 | 0.16% | 419 | 4891 | 27374 | 875 |
| 100 | Slovakia | 33136 | 0.15% | 4317 | 3723 | 10318 | 14778 |
| 101 | Albania | 33022 | 0.15% | 5121 | 6249 | 21641 | 11 |
| 102 | South Sudan | 32277 | 0.15% | 1266 | 4974 | 2603 | 7 |
| 103 | Burkina Faso | 31046 | 0.14% | 2021 | 10087 | 15747 | 3191 |
| 104 | Laos | 28924 | 0.13% | 6882 | 4089 | 17749 | 204 |
| 105 | El Salvador | 28506 | 0.13% | 8984 | 8424 | 11072 | 26 |
| 106 | Ghana | 28024 | 0.13% | 2107 | 8051 | 12883 | 4983 |
| 107 | Kyrgyzstan | 2785 | 0.13% | 6121 | 18927 | 1039 | 1763 |
| 108 | Latvia | 26808 | 0.12% | 7519 | 10213 | 4134 | 4942 |
| 109 | Rwanda | 26714 | 0.12% | 2299 | 4215 | 19609 | 591 |
| 110 | Lithuania | 26144 | 0.12% | 7452 | 5107 | 748 | 6105 |
| 111 | Nicaragua | 25373 | 0.12% | 806 | 14212 | 1255 | 1846 |
| 112 | Central African Republic | 25249 | 0.12% | 459 | 1861 | 22924 | 5 |
| 113 | Israel | 24801 | 0.11% | 585 | 5095 | 12063 | 1793 |
| 114 | Congo | 24616 | 0.11% | 2733 | 11063 | 7089 | 3731 |
| 115 | Liberia | 24507 | 0.11% | 445 | 4563 | 19498 | 1 |
| 116 | Oman | 23546 | 0.11% | 3435 | 2588 | 15395 | 2128 |
| 117 | Jamaica | 23193 | 0.11% | 1972 | 5193 | 15495 | 533 |
| 118 | Serbia | 21858 | 0.10% | 5536 | 5246 | 3832 | 7244 |
| 119 | Benin | 21289 | 0.10% | 2225 | 5104 | 13281 | 679 |
| 120 | Tunisia | 20765 | 0.10% | 4232 | 2606 | 9679 | 4248 |
| 121 | Uganda | 19523 | 0.09% | 2024 | 346 | 16224 | 929 |
| 122 | Mauritius | 19434 | 0.09% | 277 | 790 | 15209 | 3158 |
| 123 | Jordan | 19284 | 0.09% | 3021 | 2119 | 7722 | 6422 |
| 124 | U.A.E | 19198 | 0.09% | 8889 | 3172 | 2043 | 5094 |
| 125 | Costa Rica | 18924 | 0.09% | 2608 | 11277 | 361 | 4678 |
| 126 | Estonia | 18551 | 0.09% | 1859 | 3065 | 9745 | 3882 |
| 127 | Haiti | 18169 | 0.08% | 1089 | 1347 | 13913 | 182 |
| 128 | Burundi | 1745 | 0.08% | 1714 | 7571 | 8121 | 44 |
| 129 | Tajikistan | 16086 | 0.07% | 2639 | 13447 | 0 | 0 |
| 130 | East Timor | 16048 | 0.07% | 118 | 680 | 14066 | 122 |
| 131 | Iceland | 15374 | 0.07% | 4666 | 3291 | 5934 | 1483 |
| 132 | Azerbaijan | 15361 | 0.07% | 2889 | 7265 | 346 | 4861 |
| 133 | Honduras | 152 | 0.07% | 2625 | 4696 | 5421 | 2458 |
| 134 | Guinea-Bissau | 13636 | 0.06% | 71 | 3301 | 10257 | 7 |
| 135 | Malawi | 13238 | 0.06% | 3352 | 7122 | 2625 | 139 |
| 136 | Puerto Rico | 12934 | 0.06% | 2543 | 2539 | 3415 | 4437 |
| 137 | Palestine | 12817 | 0.06% | 1035 | 751 | 2412 | 8619 |
| 138 | Slovenia | 12474 | 0.06% | 2223 | 2686 | 3689 | 3876 |
| 139 | Gabon | 12286 | 0.06% | 181 | 945 | 1115 | 10 |
| 140 | Cyprus | 11721 | 0.05% | 1488 | 2311 | 2266 | 5656 |
| 141 | Lebanon | 11399 | 0.05% | 2164 | 2368 | 4097 | 277 |
| 142 | Dominican Republic | 1089 | 0.05% | 1148 | 3809 | 1152 | 4781 |
| 143 | Panama | 10417 | 0.05% | 3887 | 3718 | 2811 | 1 |
| 144 | Armenia | 9888 | 0.05% | 1231 | 2874 | 1578 | 4205 |
| 145 | Belize | 9817 | 0.05% | 680 | 5153 | 3984 | 0 |
| 146 | Qatar | 9047 | 0.04% | 557 | 2046 | 588 | 843 |
| 147 | Moldova | 886 | 0.04% | 119 | 2898 | 4751 | 21 |
| 148 | Georgia | 8043 | 0.04% | 1192 | 5412 | 198 | 1241 |
| 149 | Bosnia | 7769 | 0.04% | 3239 | 1332 | 2529 | 669 |
| 150 | Togo | 7423 | 0.03% | 855 | 970 | 2927 | 2671 |
| 151 | Eritrea | 7101 | 0.03% | 477 | 30 | 6592 | 2 |
| 152 | Western Sahara | 6794 | 0.03% | 182 | 568 | 6041 | 3 |
| 153 | Djibouti | 6786 | 0.03% | 675 | 1673 | 4438 | 0 |
| 154 | Gambia | 5112 | 0.02% | 85 | 14 | 3612 | 15 |
| 155 | Luxembourg | 5106 | 0.02% | 1186 | 1916 | 381 | 1623 |
| 156 | Guyana | 4323 | 0.02% | 0 | 929 | 3394 | 0 |
| 157 | Guadeloupe | 4303 | 0.02% | 438 | 523 | 2017 | 1325 |
| 158 | Northern Macedonia | 415 | 0.02% | 1332 | 1421 | 991 | 406 |
| 159 | Singapore | 3547 | 0.02% | 1561 | 417 | 193 | 1376 |
| 160 | French Guiana | 3316 | 0.02% | 475 | 1822 | 993 | 26 |
| 161 | Lesotho | 3157 | 0.01% | 267 | 635 | 225 | 5 |
| 162 | Martinique | 2857 | 0.01% | 323 | 442 | 1211 | 881 |
| 163 | Montenegro | 281 | 0.01% | 842 | 519 | 809 | 640 |
| 164 | Eswatini | 2664 | 0.01% | 648 | 1061 | 955 | 0 |
| 165 | Equatorial Guinea | 2609 | 0.01% | 0 | 210 | 2399 | 0 |
| 166 | Netherlands Antilles | 2549 | 0.01% | 310 | 151 | 747 | 1341 |
| 167 | Cabo Verde | 2392 | 0.01% | 99 | 333 | 1959 | 1 |
| 168 | Bhutan | 2376 | 0.01% | 1871 | 0 | 499 | 6 |
| 169 | New Caledonia | 2213 | 0.01% | 340 | 1873 | 0 | 0 |
| 170 | Suriname | 1921 | 0.01% | 103 | 891 | 0 | 0 |
| 171 | Barbados | 1806 | 0.01% | 244 | 364 | 361 | 837 |
| 172 | Kuwait | 1651 | 0.01% | 1334 | 128 | 64 | 125 |
| 173 | Malta | 1637 | 0.01% | 228 | 223 | 173 | 1013 |
| 174 | U.S. Virgin Islands | 1429 | 0.01% | 211 | 129 | 71 | 1018 |
| 175 | Solomon Islands | 1309 | 0.01% | 0 | 0 | 1309 | 0 |
| 176 | The Bahamas | 1285 | 0.01% | 0 | 1215 | 70 | 0 |
| 177 | Fiji | 1134 | 0.01% | 407 | 727 | 0 | 0 |
| 178 | Antigua and Barbuda | 1125 | 0.01% | 134 | 53 | 343 | 595 |
| 179 | Kosovo | 1111 | 0.01% | 366 | 449 | 296 | 0 |
| 180 | Aruba | 890 | 0.00% | 31 | 75 | 123 | 661 |
| 181 | Dominica | 862 | 0.00% | 224 | 60 | 237 | 341 |
| 182 | Faroe Islands | 826 | 0.00% | 246 | 130 | 42 | 408 |
| 183 | St. Lucia | 793 | 0.00% | 115 | 51 | 394 | 233 |
| 184 | Cayman Islands | 746 | 0.00% | 168 | 55 | 90 | 433 |
| 185 | Brunei | 660 | 0.00% | 0 | 0 | 660 | 0 |
| 186 | Trinidad and Tobago | 636 | 0.00% | 65 | 571 | 0 | 0 |
| 187 | Isle of Man | 610 | 0.00% | 336 | 120 | 21 | 133 |
| 188 | Sao Tome and Principe | 538 | 0.00% | 123 | 0 | 415 | 0 |
| 189 | Grenada | 516 | 0.00% | 173 | 55 | 175 | 113 |
| 190 | Bahrain | 502 | 0.00% | 502 | 0 | 0 | 0 |
| 191 | Falkland Island | 485 | 0.00% | 0 | 485 | 0 | 0 |
| 192 | Reunion | 465 | 0.00% | 190 | 146 | 129 | 0 |
| 193 | St. Kitts and Nevis | 446 | 0.00% | 54 | 42 | 97 | 253 |
| 194 | Vanuatu | 445 | 0.00% | 0 | 445 | 0 | 0 |
| 195 | St. Vincent & the Grenadines | 389 | 0.00% | 50 | 53 | 160 | 126 |
| 196 | Comoros | 384 | 0.00% | 0 | 0 | 384 | 0 |
| 197 | Samoa | 342 | 0.00% | 0 | 342 | 0 | 0 |
| 198 | British Virgin Islands | 297 | 0.00% | 72 | 39 | 119 | 67 |
| 199 | Anguila | 209 | 0.00% | 42 | 11 | 45 | 111 |
| 200 | Guam | 201 | 0.00% | 123 | 78 | 0 | 0 |
| 201 | French Polynesia | 175 | 0.00% | 54 | 121 | 0 | 0 |
| 202 | Northern Mariana Islands | 145 | 0.00% | 87 | 58 | 0 | 0 |
| 203 | Tonga | 135 | 0.00% | 10 | 125 | 0 | 0 |
| 204 | Montserrat | 125 | 0.00% | 20 | 2 | 33 | 70 |
| 205 | San Marino | 118 | 0.00% | 13 | 11 | 58 | 36 |
| 206 | Mayotte | 109 | 0.00% | 0 | 0 | 109 | 0 |
| 207 | Niue | 91 | 0.00% | 0 | 91 | 0 | 0 |
| 208 | Turks & Caicos Island | 75 | 0.00% | 0 | 9 | 66 | 0 |
| 209 | Seychelles | 70 | 0.00% | 0 | 32 | 38 | 0 |
| 210 | Saint Helena | 57 | 0.00% | 22 | 35 | 0 | 0 |
| 211 | Cook Islands | 47 | 0.00% | 0 | 47 | 0 | 0 |
| 212 | Monaco | 42 | 0.00% | 14 | 6 | 7 | 15 |
| 213 | Andorra | 36 | 0.00% | 29 | 7 | 0 | 0 |
| 214 | Gibraltar | 29 | 0.00% | 7 | 8 | 6 | 8 |
| 215 | Wallis & Futura Islands | 25 | 0.00% | 0 | 25 | 0 | 0 |
| 216 | Liechtenstein | 24 | 0.00% | 9 | 6 | 1 | 8 |
| 217 | Palau | 18 | 0.00% | 0 | 18 | 0 | 0 |
| 218 | American Samoa | 17 | 0.00% | 0 | 17 | 0 | 0 |
| 219 | French Southern & Antarctic Lands | 15 | 0.00% | 0 | 15 | 0 | 0 |
| 220 | Bermuda | 14 | 0.00% | 0 | 14 | 0 | 0 |
| 221 | Christmas Island | 12 | 0.00% | 12 | 0 | 0 | 0 |
| 222 | Norfolk Island | 10 | 0.00% | 0 | 10 | 0 | 0 |
| Total | 21600760 | 100.00% | 2653200 | 4432469 | 7263728 | 4676472 |
The various road types greatly impact how road maps look in different regions.
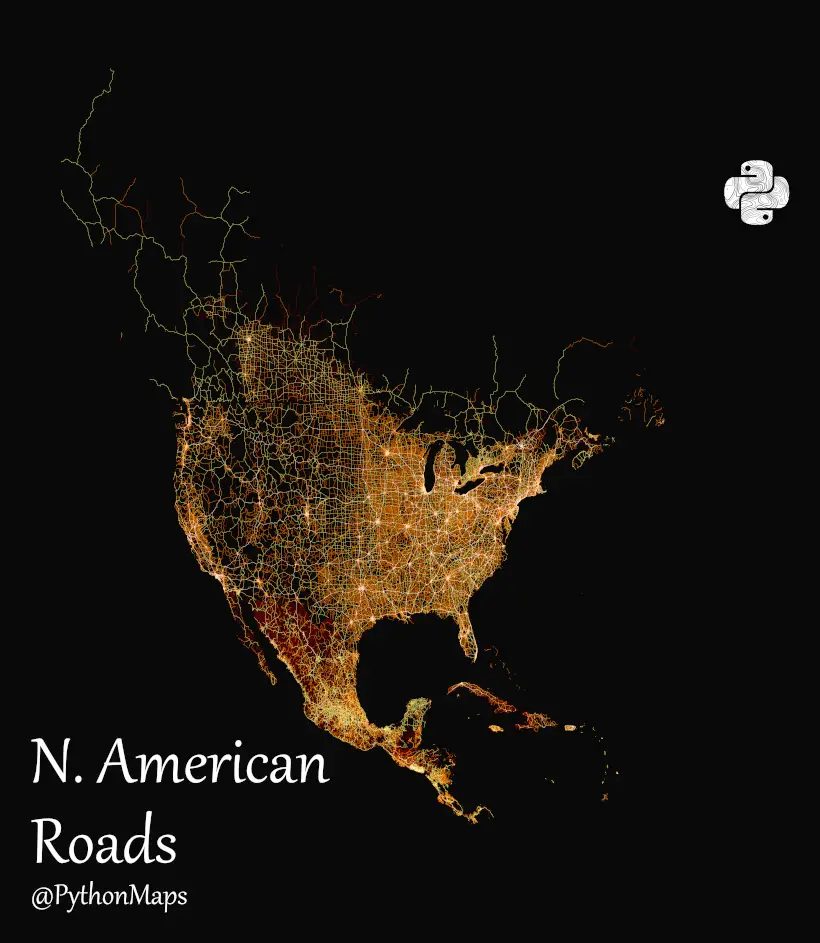
Due to the extensive network of highways, primary and secondary roads in North America, the roads in the United States and Canada are marked with a white-yellow hue.
In Mexico, the majority of the country’s road network is made up of tertiary and local roads, which gives the map a distinct red tint.
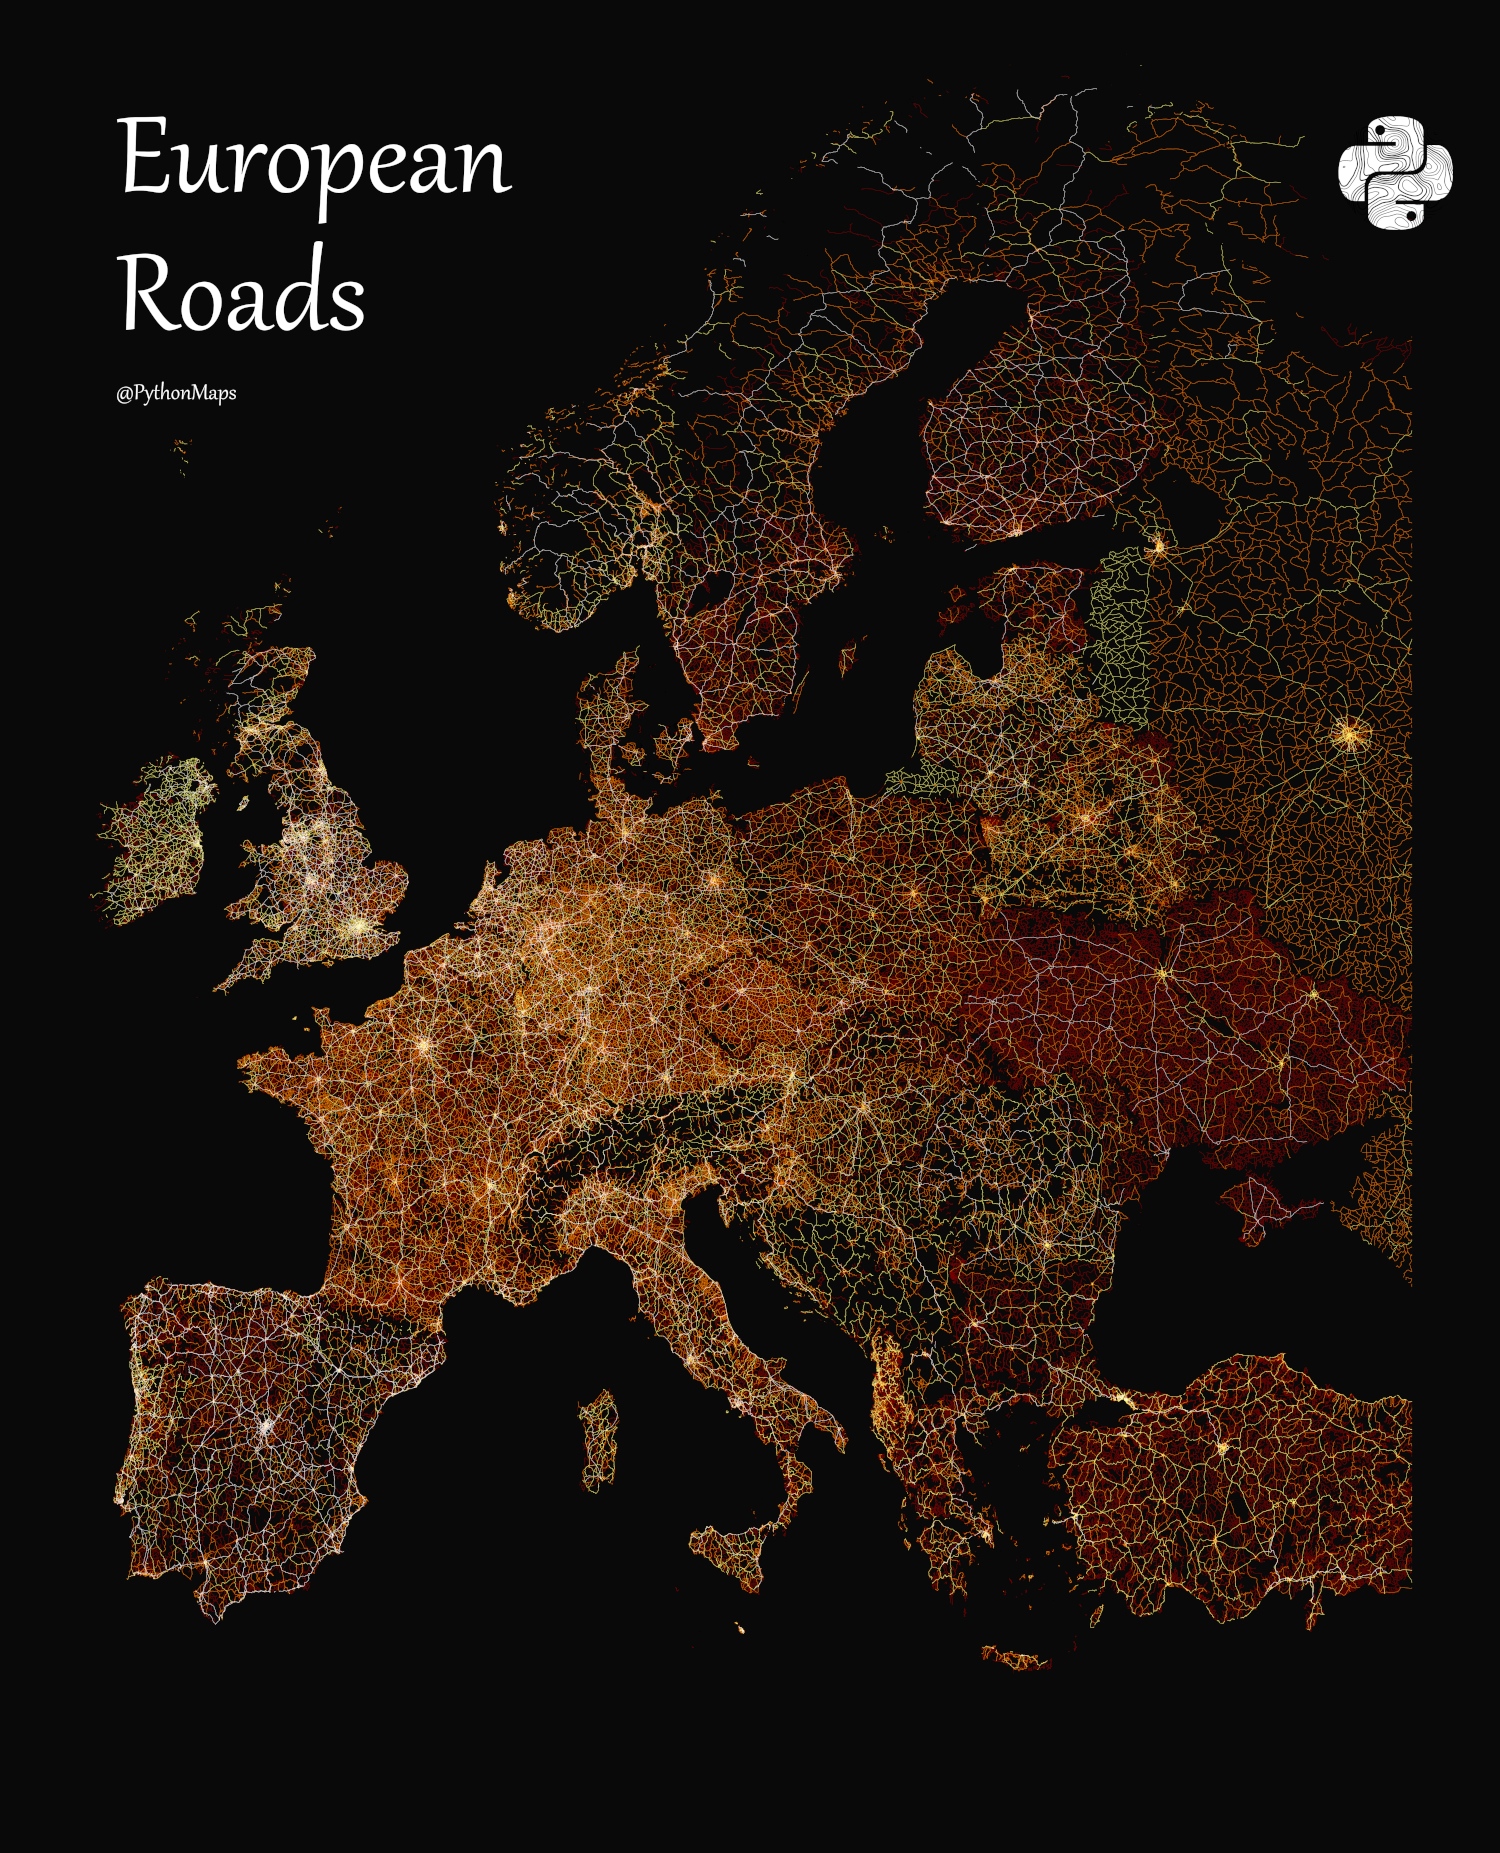
In Europe, there are still remnants of the Cold War divisions reflected in the colors white, yellow, and red. The countries of France, Germany, Italy, and the United Kingdom are shown mainly as white and yellow on the map. Meanwhile, the former Eastern Bloc countries appear more in red.
The differences between North America and Europe are especially noticeable in the ratio of lengths of roads to railroads.
According to the Global Roads Inventory Project, North America, Europe, and China have more main roads (highways and primary), while the majority of the world has a greater proportion of secondary (yellow) and local tertiary (red) roads. However, some countries in the Middle East (Bahrain, Kuwait, Bhutan, Qatar, Suriname) have the highest percentage of main roads.
The length of a country’s roads is closely positively correlated with its land surface area, population density, and gross domestic product.
Out of all the correlations, population density is the most noticeable in larger world maps, like the one of Asia shown here.
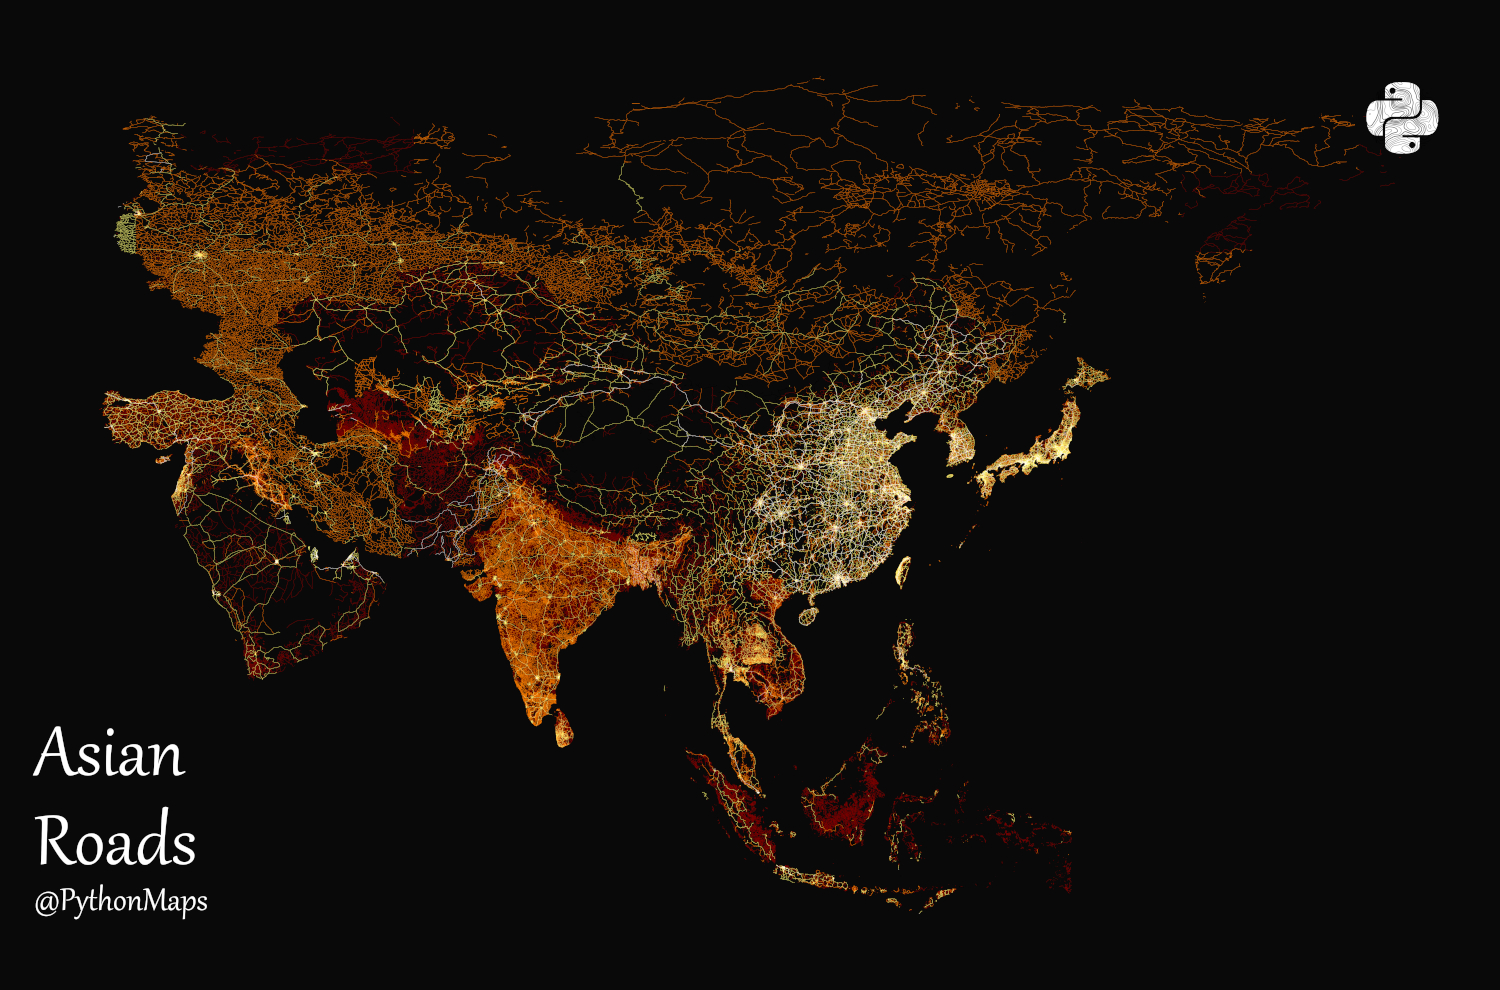
The two regions with the highest population in the world are the Indian subcontinent and Eastern China, which together make up about 35% of the global population. The areas with the highest population, particularly in China, have developed more roads to accommodate the growth of cities and urban areas.
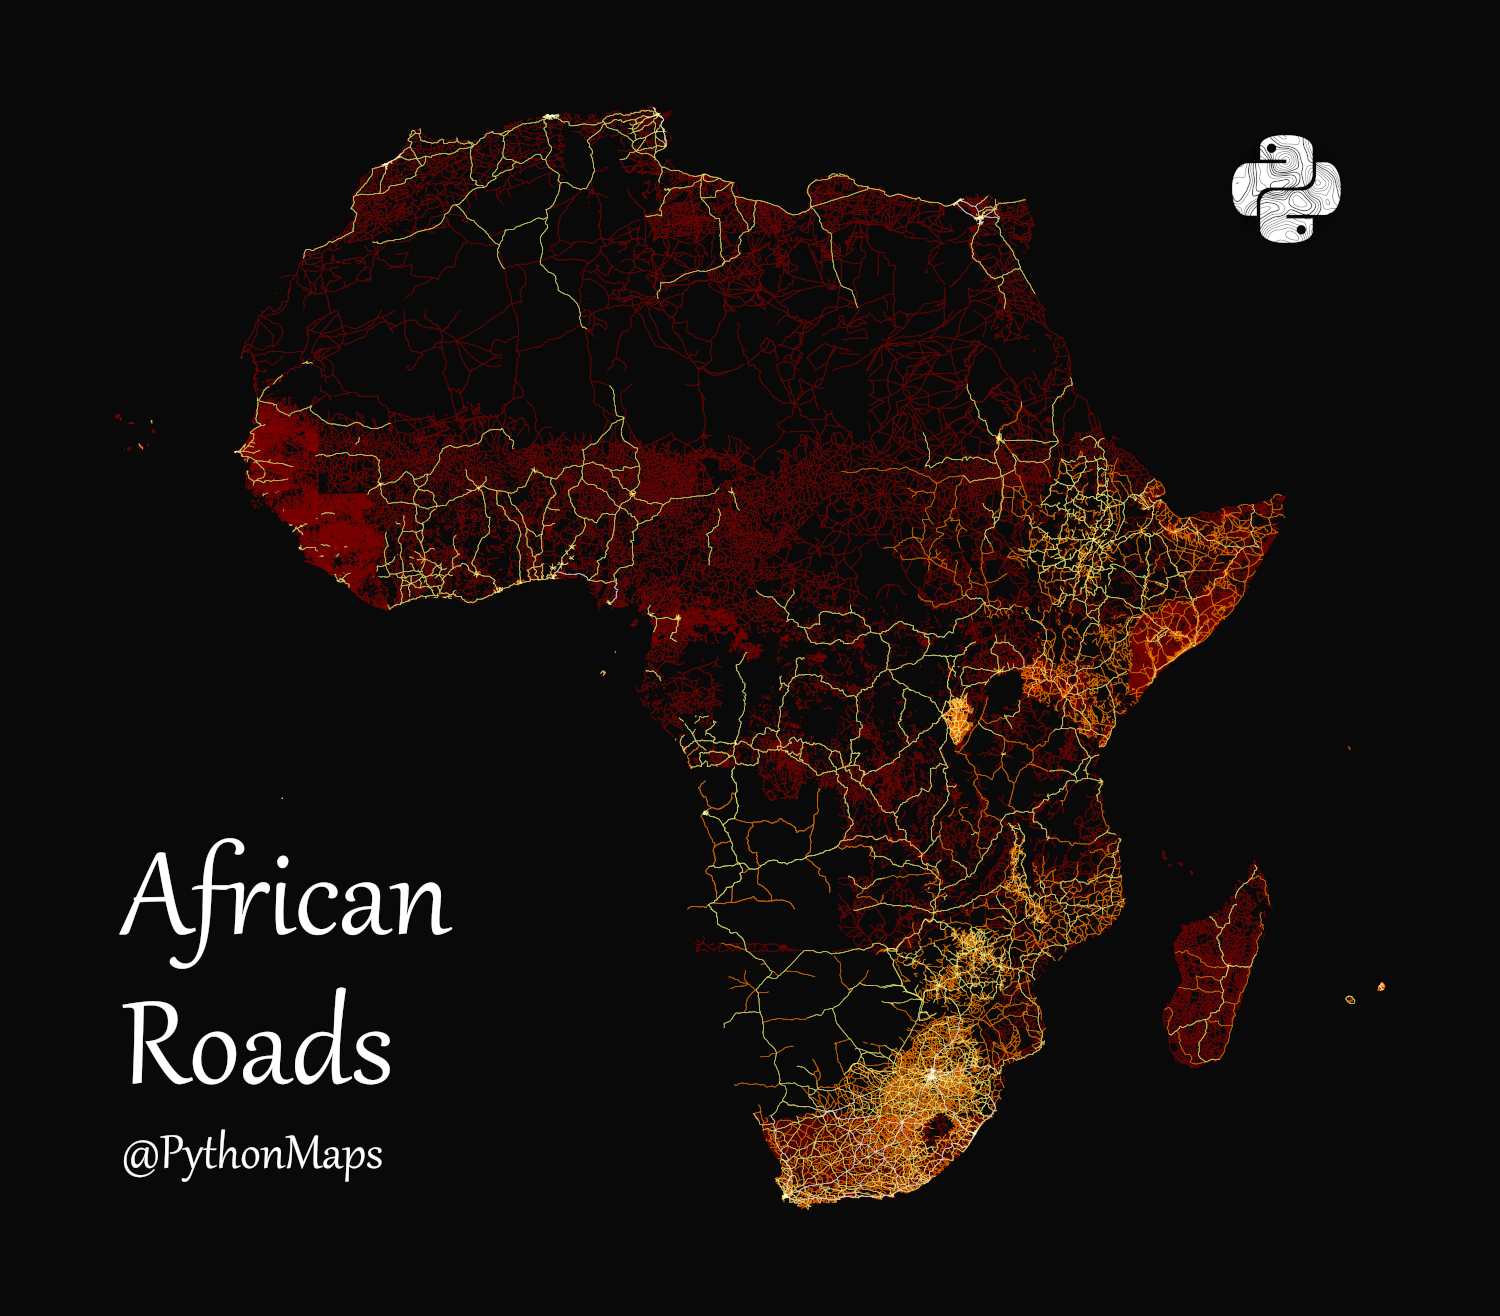
In contrast, Africa and Australia have vast natural features such as deserts that hinder human settlements. As a result, roads are not visible in the visualization.
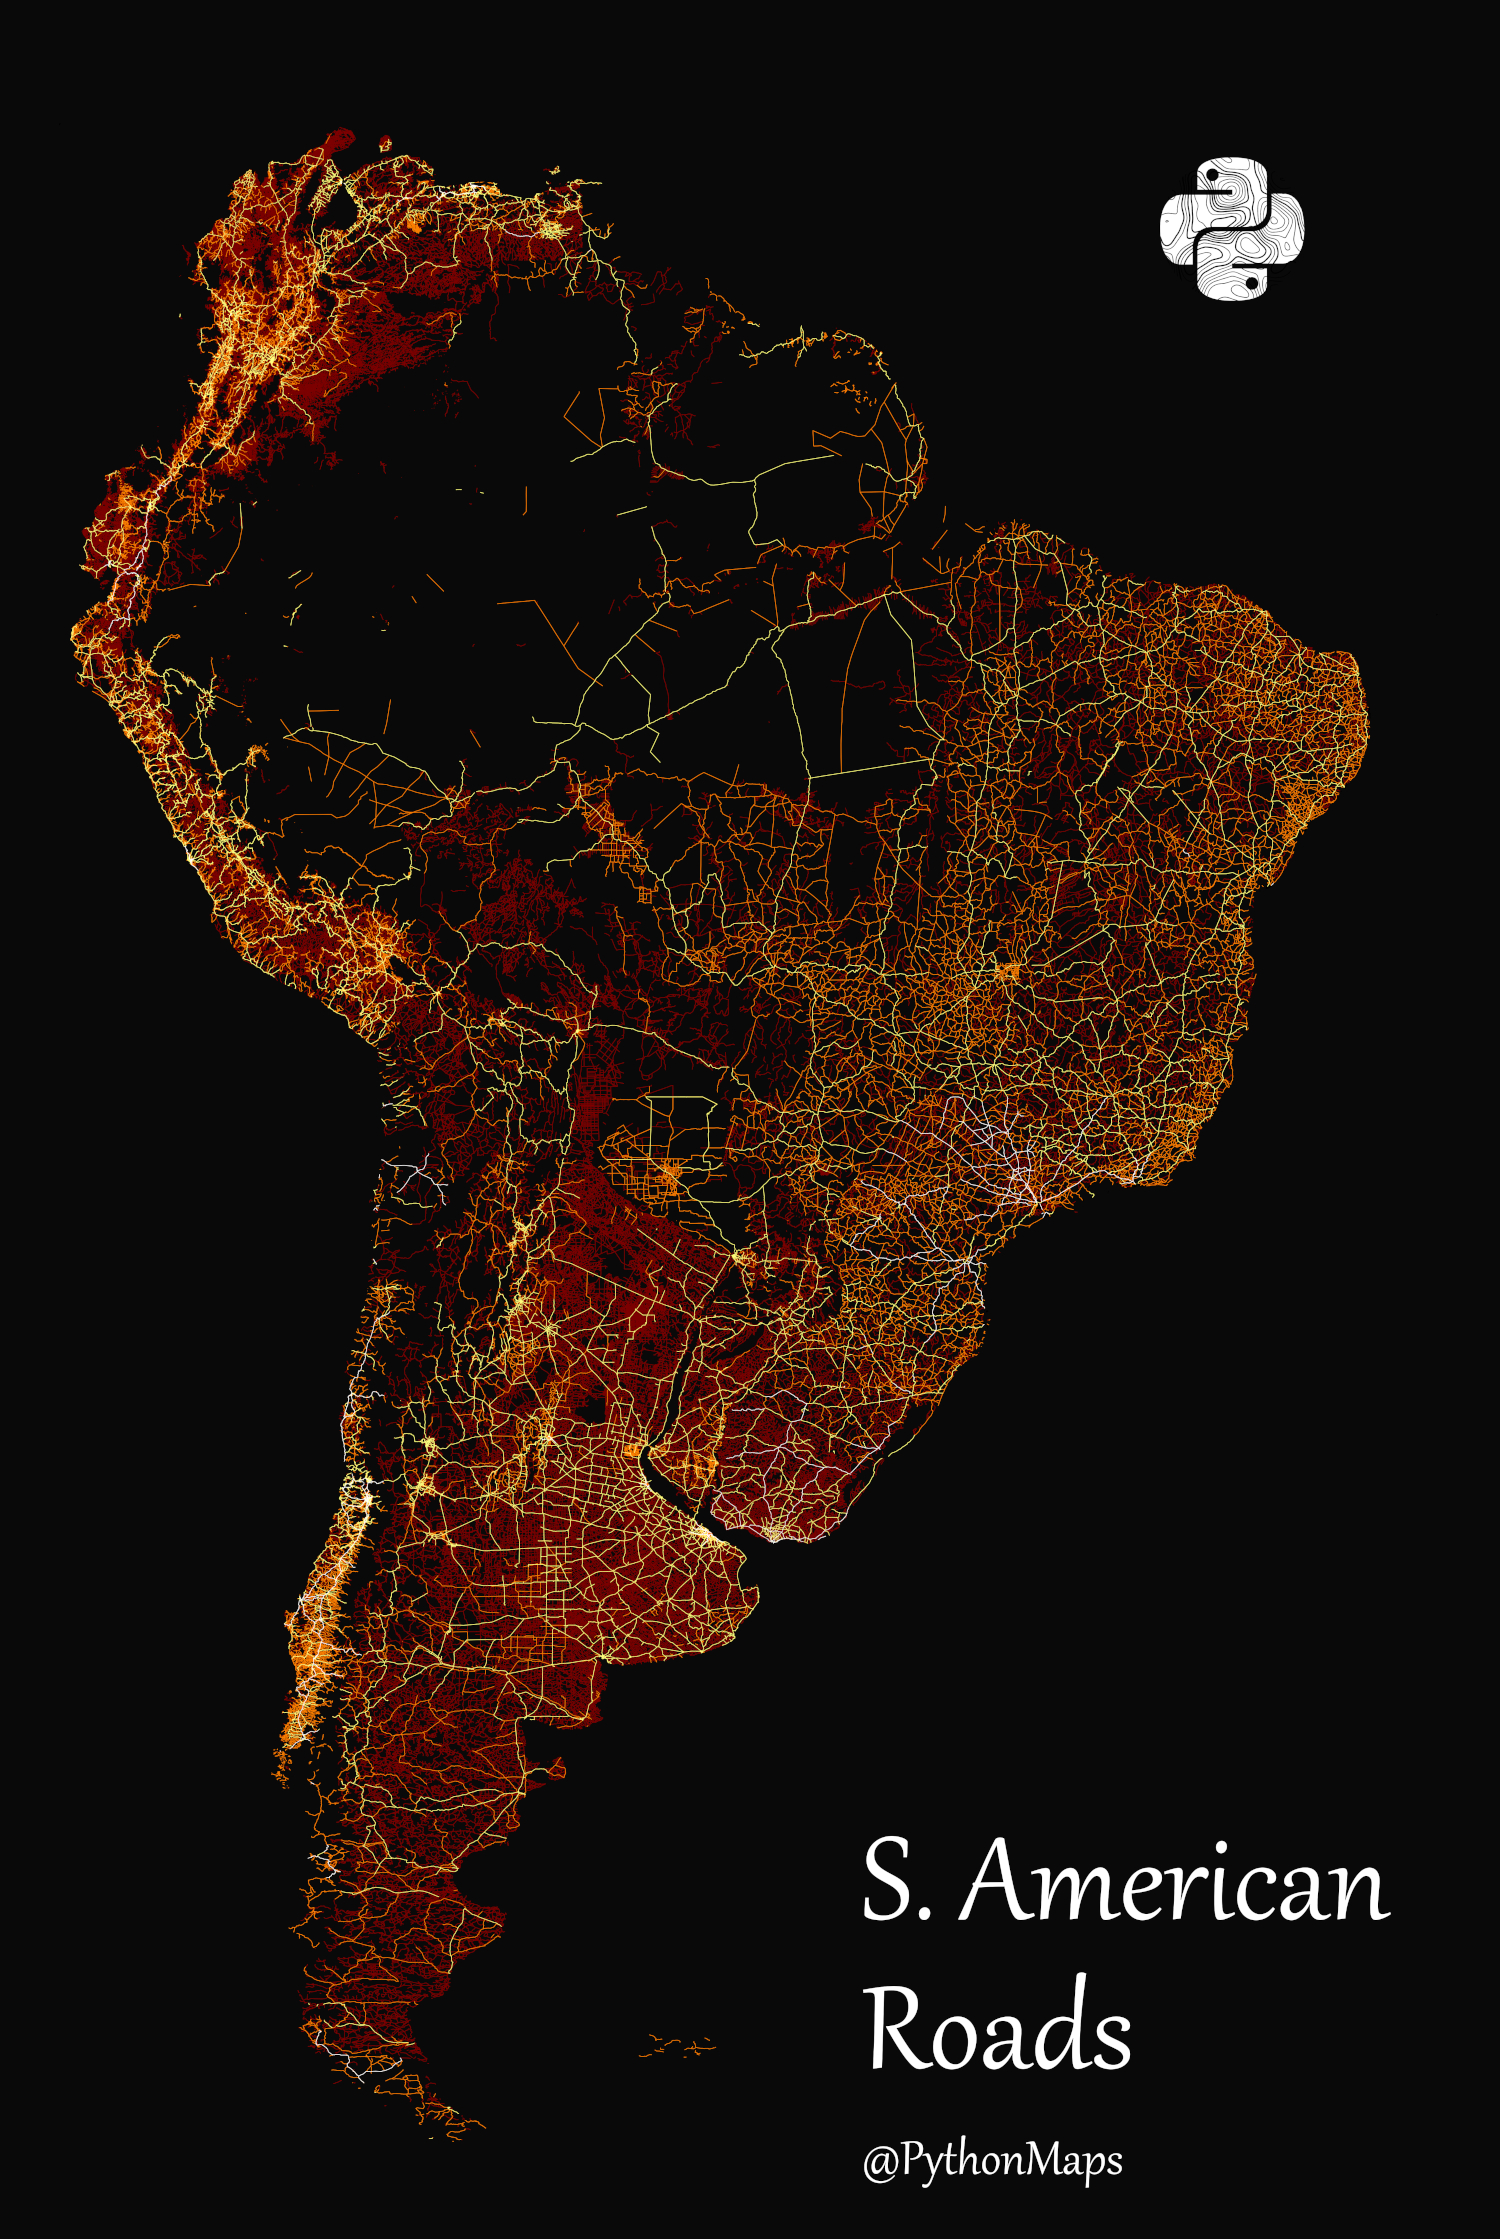
In South America, rainforests are a serious obstacle to road construction, but unfortunately, the road network is developing there as well, posing a threat to unique biodiversity.