Worldwide Airline Routes
A single-seat Benoist biplane carried a paying passenger across Tampa Bay in 1914, with Tony Jannus at the controls. That short hop was the first commercial passenger flight and the moment someone realized people might travel by air on purpose.
In the 1920s and 1930s airlines experimented with ways to make flying pay. Carrying the mail proved reliable: postal contracts kept pilots in the air and let carriers add a few fare-paying passengers on the side. In April 1926 Western Air Express began hauling mail; within weeks it was operating a Salt Lake City–to–Los Angeles service that stopped in Las Vegas and accepted passengers. Aircraft of the era were noisy and unpressurized, fuel stops were frequent, and night flying was limited — yet ridership climbed from only a few thousand people in the mid-1920s to the low hundreds of thousands by the end of the decade.
Map of significant world air routes in 1920

After World War II the industry changed quickly. Jet engines increased range and speed, airfields were lengthened and modernized, and ticket costs fell enough that flying became routine for many travelers. Local lines multiplied into networks that linked regions and continents.
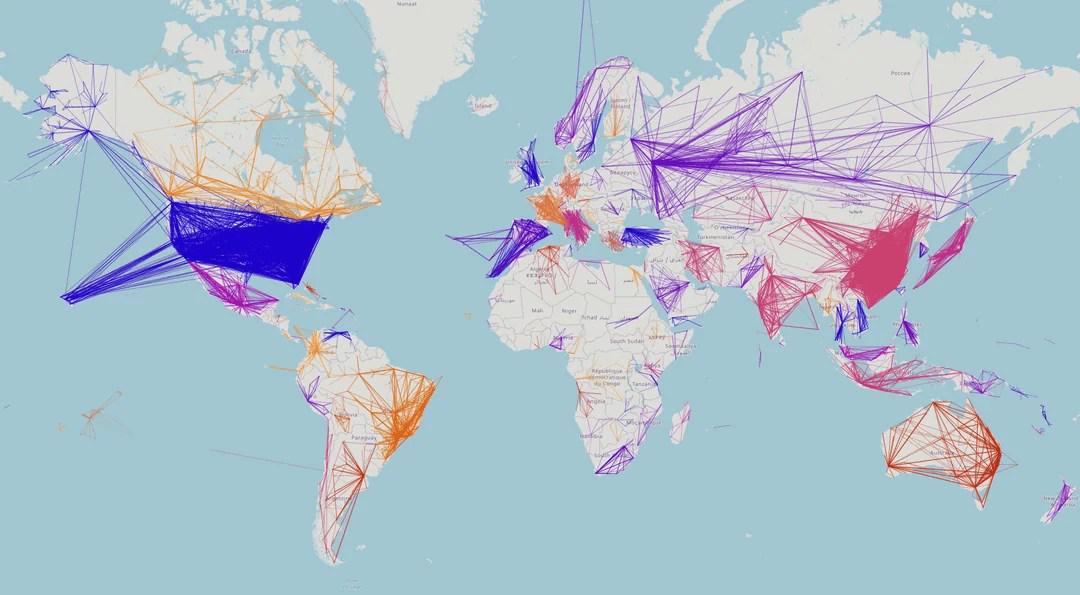
The map below created by kevish shows Worldwide airline routes & flight patterns

Air travel volumes have reached numbers that would have looked impossible a century ago. Industry data puts global passenger traffic near five billion in the most recent full year, with year-on-year growth of around 10 percent. The United States remained the largest market with roughly 876 million passengers in 2024; China followed with about 741 million and posted much faster growth.
The map below shows only domestic flights within countries.
How the web of routes grew into its present shape is visible in some widely used visual datasets. One frequently cited animation and dataset plots roughly 3,200 airports and about 60,000 regularly flown routes, which is why the network graphic can look like a tightly woven web in places.
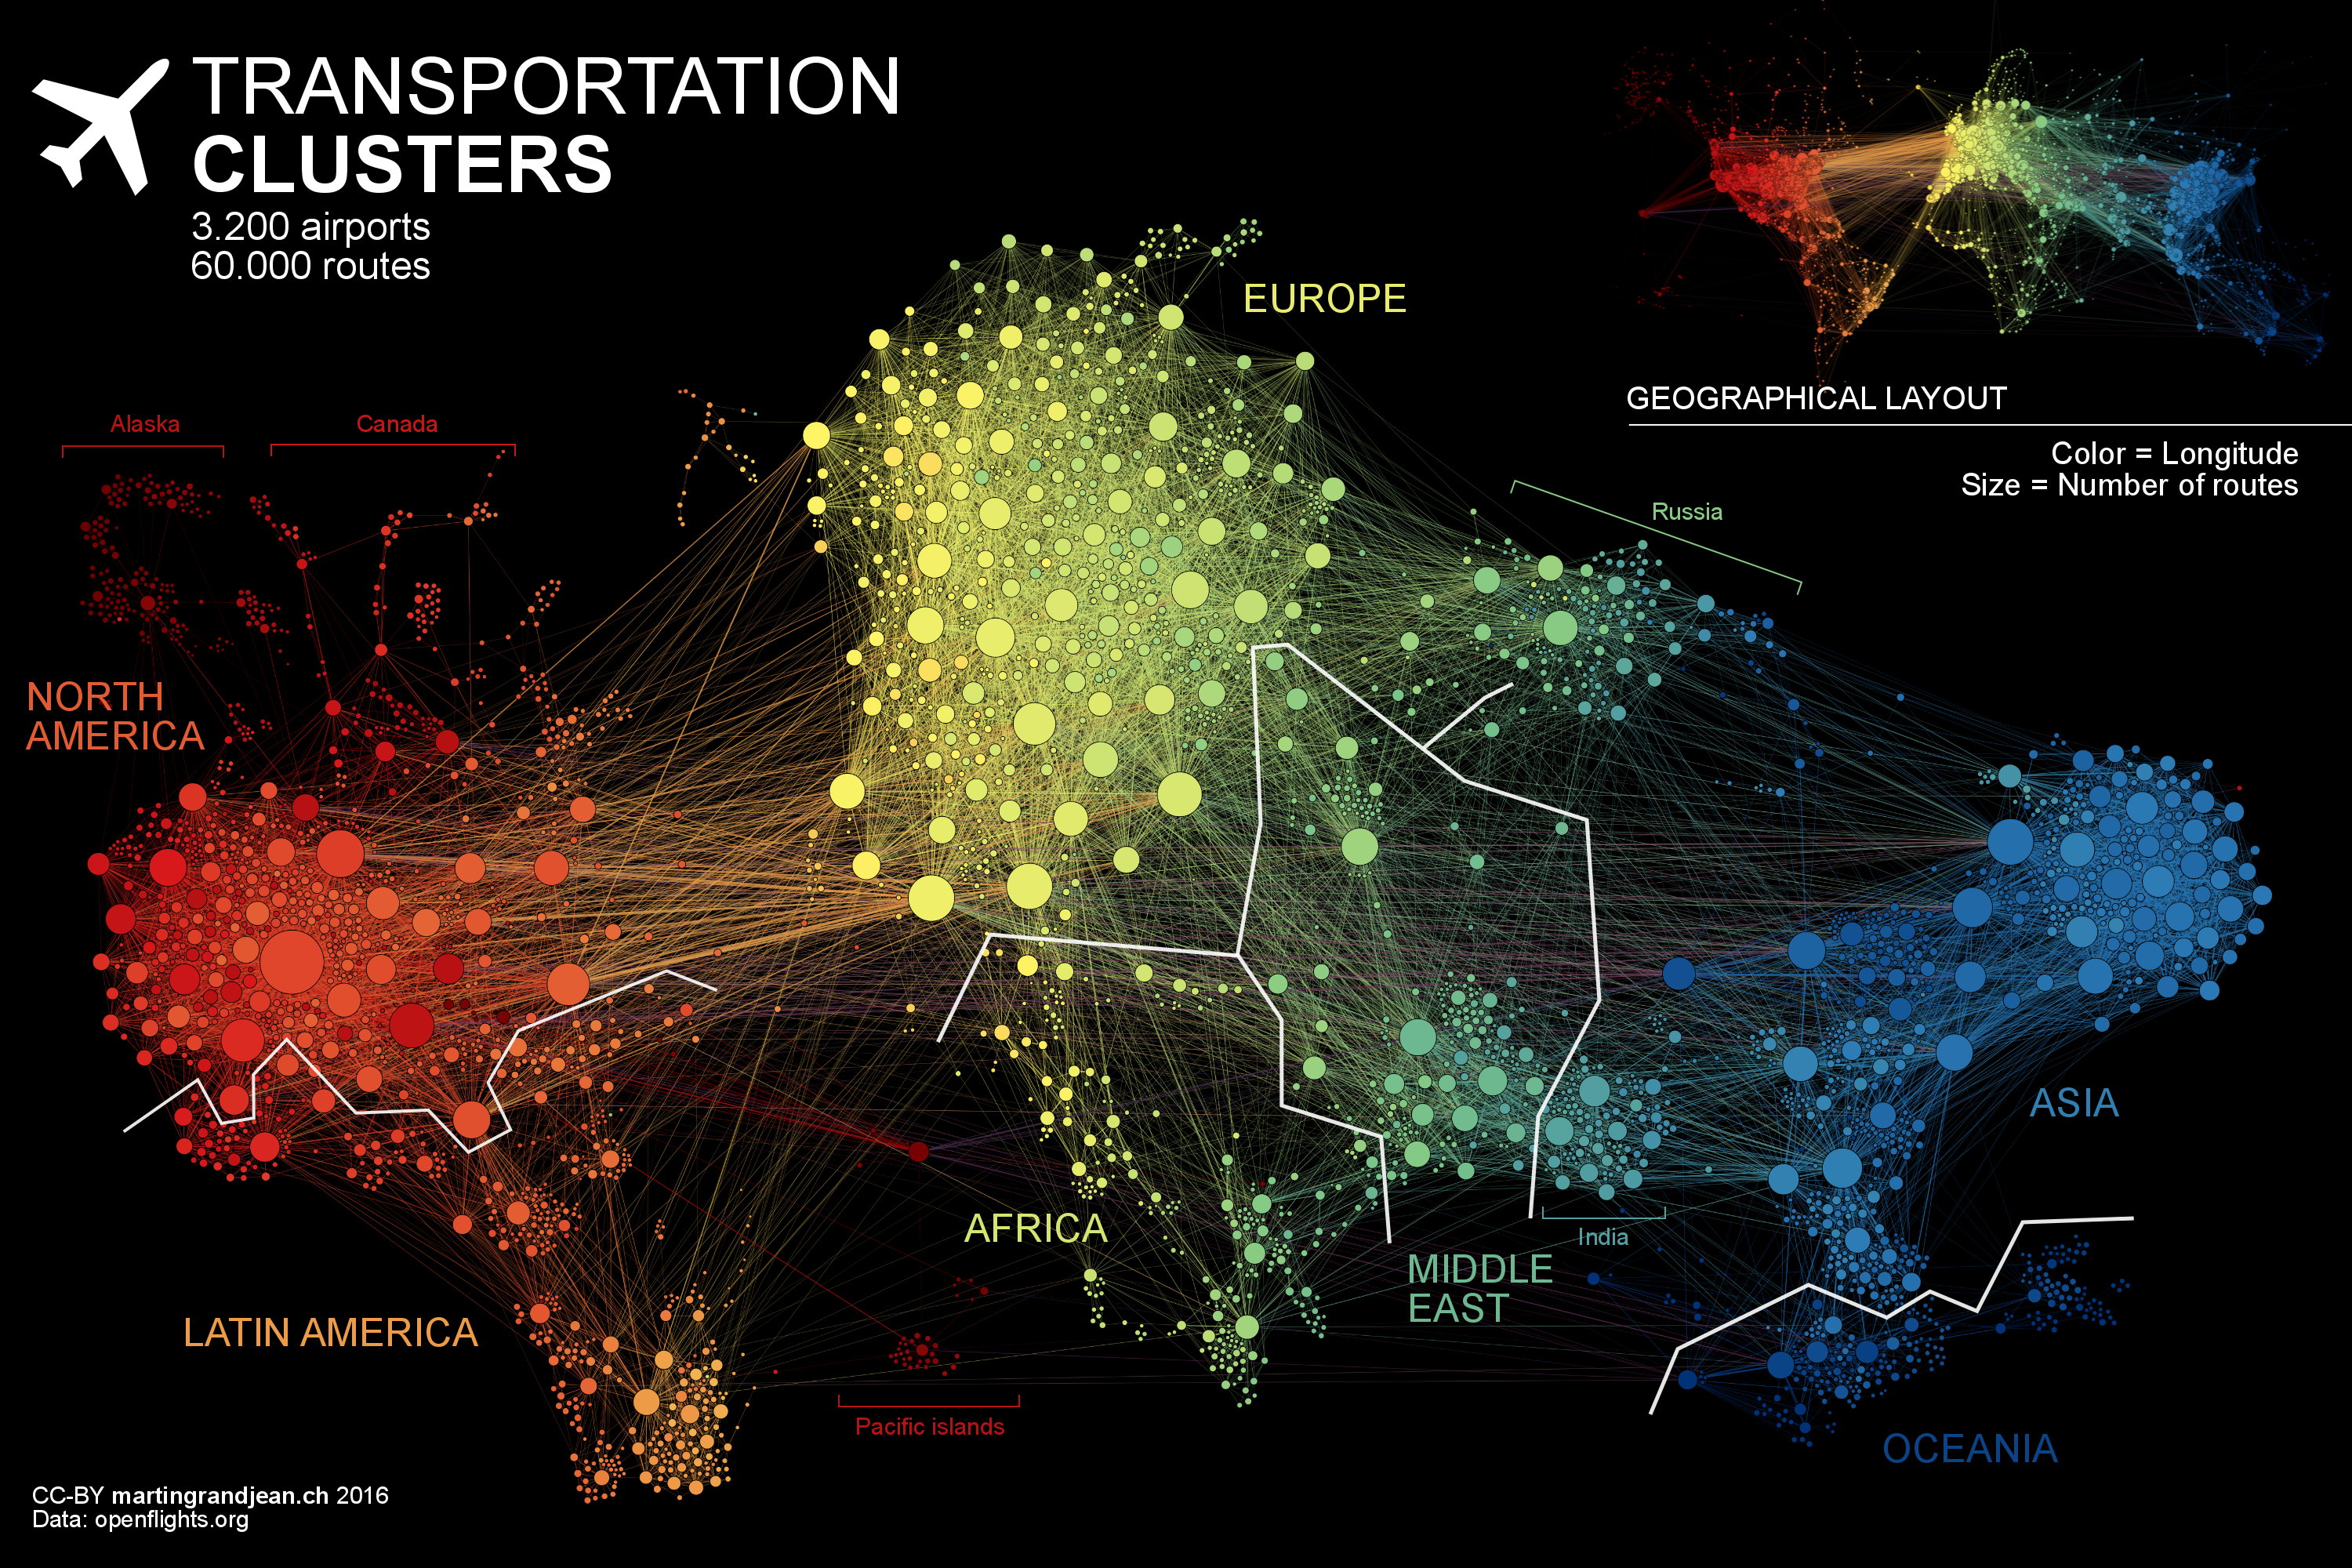
Certain airports sit at the center of international transfers and show very high connectivity scores. Heathrow, Frankfurt, Amsterdam Schiphol, O’Hare, Toronto Pearson and Singapore Changi are examples of gateways that also shape route geometry on a continental scale.
The worlds most airports by connectivity index
1. Heathrow (United Kingdom) – 379
2. Frankfurt (Germany) – 307
3. Amsterdam Schiphol (Netherlands) – 299
4. O’Hare (United States) – 295
5. Toronto Pearson (Canada) – 271
6. Singapore Changi (Singapore) – 257
7. Soekarno–Hatta (Indonesia) – 256
8. Hartsfield–Jackson (United States) – 256
9. Kuala Lumpur (Malaysia) – 242
10. Charles de Gaulle (France) – 242
11. Los Angeles (United States) – 235
12. Hong Kong (Hong Kong) – 233
13. Suvarnabhumi (Thailand) – 226
14. Munich (Germany) – 221
15. Istanbul Atatürk (Turkey) – 219
16. Miami (United States) – 204
17. Incheon (South Korea) – 196
18. John F. Kennedy (United States) – 195
19. George Bush (United States) – 184
20. Dubai (United Arab Emirates) – 183
21. Mexico City (Mexico) – 176
22. Newark Liberty (United States) – 170
23. Shanghai Pudong (China) – 167
24. Sydney (Australia) – 167
25. Indira Gandhi (India) – 166
26. Vancouver (Canada) – 165
27. Dallas/Fort Worth (United States) – 164
28. Haneda (Japan) – 163
29. San Francisco (United States) – 153
30. Rome Fiumicino (Italy) – 145
31. Beijing Capital (China) – 142
32. Guangzhou Baiyun (China) – 141
33. Chhatrapati Shivaji (India) – 140
34. Madrid–Barajas (Spain) – 138
35. Nice Côte d’Azur (France) – 133
36. O. R. Tambo (South Africa) – 133
37. Narita (Japan) – 132
38. Ninoy Aquino (Philippines) – 131
39. Seattle–Tacoma (United States) – 130
40. Logan (United States) – 128
41. El Dorado (Colombia) – 127
42. São Paulo–Guarulhos (Brazil) – 120
43. Montréal–Trudeau (Canada) – 118
44. Zurich (Switzerland) – 115
45. Sheremetyevo (Russia) – 114
46. Luis Muñoz Marín (Puerto Rico) – 114
47. Tocumen (Panama) – 108
48. Vienna (Austria) – 107
49. Orlando (United States) – 107
50. Auckland (New Zealand) – 106

If you’re curious why flights rarely run straight, the follow-up is here.
 Airlines for Domestic Flights—By State")


")

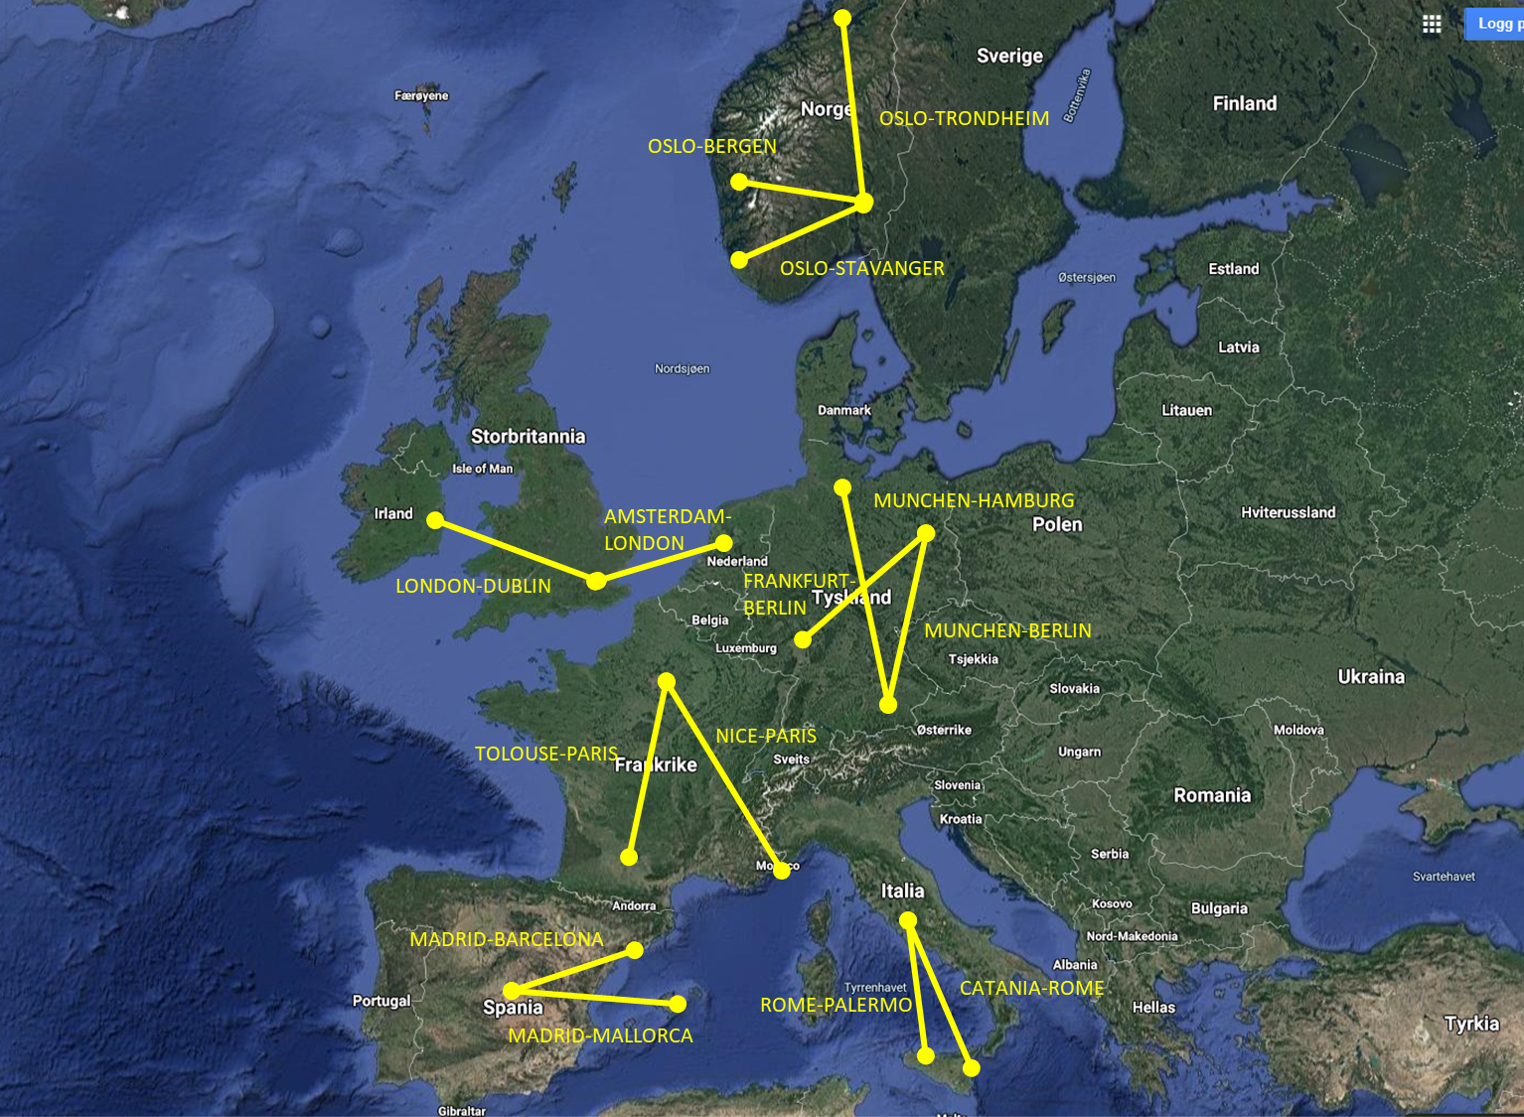
Top 10 Busiest European Flight Routes
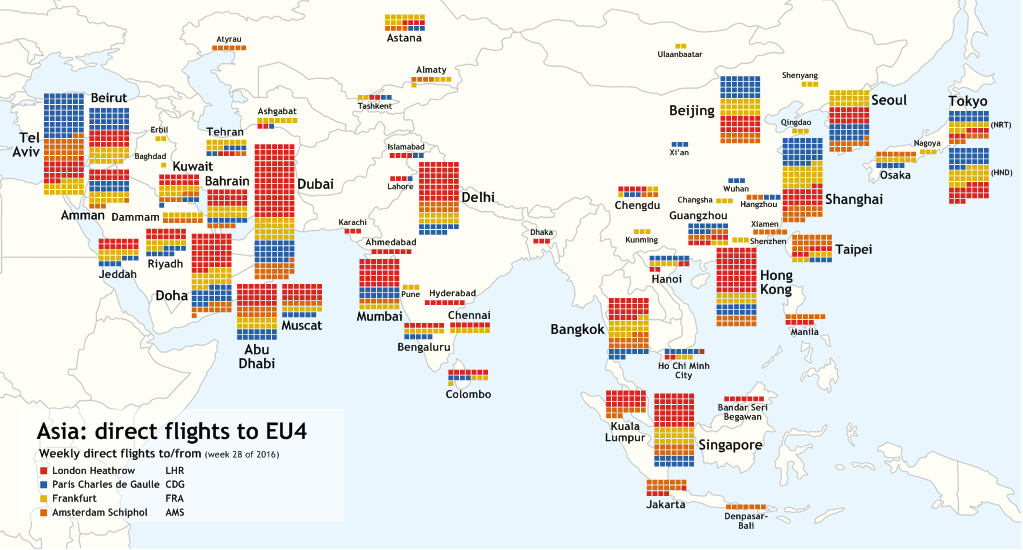
Direct flights to Asia from the four largest European airports