Mapping Australia: Housing affordability
The map shows the monetary gap (%) between the average earnings and the estimated minimum earnings required to purchase the
Read MoreThe map shows the monetary gap (%) between the average earnings and the estimated minimum earnings required to purchase the
Read MoreThe typical millennial in 13 US metropolitan areas doesn’t earn enough to buy a home. Source: Bloomberg
Read MoreThe map below presents a full-time minimum salary worker will be able to afford to rent a one-bedroom apartment in Sydney.
Read More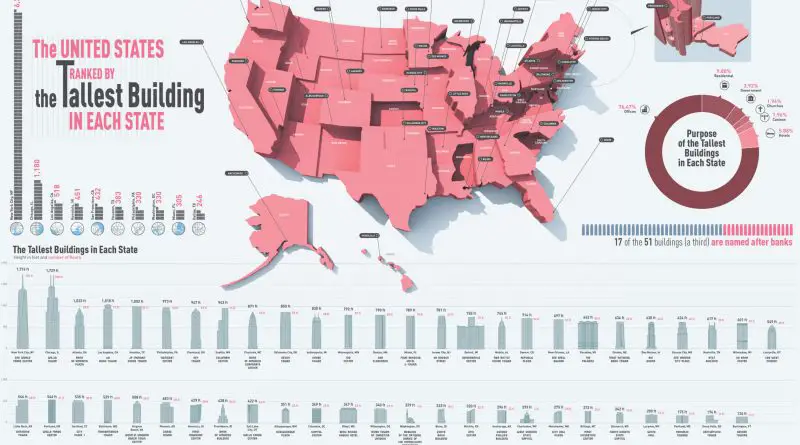
The U.S. has more than 2,6 thousand buildings taller than one hundred meters. Twenty highest buildings in the U.S. are located in New York. 76 percents of American skyscrapers are office buildings.
Read MoreRepresents the hourly wage that a household must earn (working 40 hours a week, 52 weeks a year) in order
Read MoreIn only 12 U.S. counties can a full-time worker earning the prevailing federal or state minimum-wage afford a one-bedroom rental
Read More