All of these blue countries combined had the same number of homicides as the United States last year
Map created with mapchart.net
Read MoreMap created with mapchart.net
Read More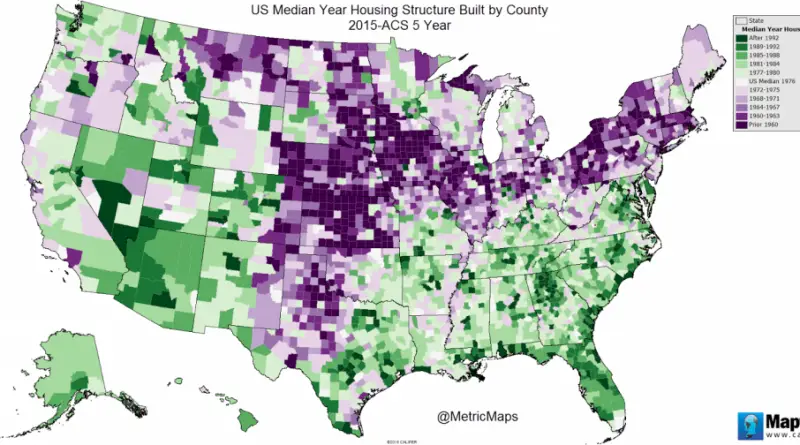
www.metricmaps.com
Read MoreThis 3D map shows what construction will do to every neighborhood’s skyline to help you see how you could be
Read MoreAcre (164.123 km²) — Nepal (147.181km²)Alagoas (27.778 km²) — Haiti (27.750km²)Amapá (142.828 km²) — Tajikistan (143.100 km²)Amazonas (1.559.159 km²) —
Read More
Land values in New York City are among the highest in the world, driven by factors like high demand, limited space, and stringent zoning regulations. Prime areas in Manhattan command the highest prices, with some properties selling for hundreds of millions of dollars. Outer boroughs offer relatively more affordable land, but prices still vary by neighborhood and factors like development potential and accessibility to amenities. The city’s dynamic real estate market and global appeal continue to shape land values, with luxury developments and investments playing a significant role in the ever-evolving landscape.
Read MoreThe Dutch stereotype map of Europe. Victor Van www.werkhooven.nl
Read MoreThe Atlas of ReUrbanism is a tool to understand, support, and transform American cities. Developed by the Preservation Green
Read More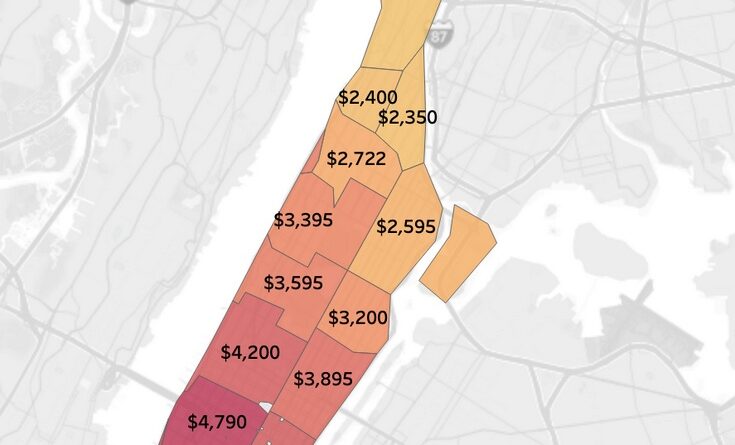
Rental prices in New York City varied widely depending on the borough, neighborhood, and the type of housing. Manhattan, being the most central and desirable borough, generally had the highest rental prices. Brooklyn and Queens were also popular but tended to be relatively more affordable than Manhattan. The Bronx and Staten Island typically had lower average rental prices compared to the other boroughs.
Read MoreUnited States counties: renters paying 30% or more of their income on rent.
Read MoreSince 1994, the City Council and state legislature have gradually dismantled legal protections for New York City tenants, giving landlords
Read More