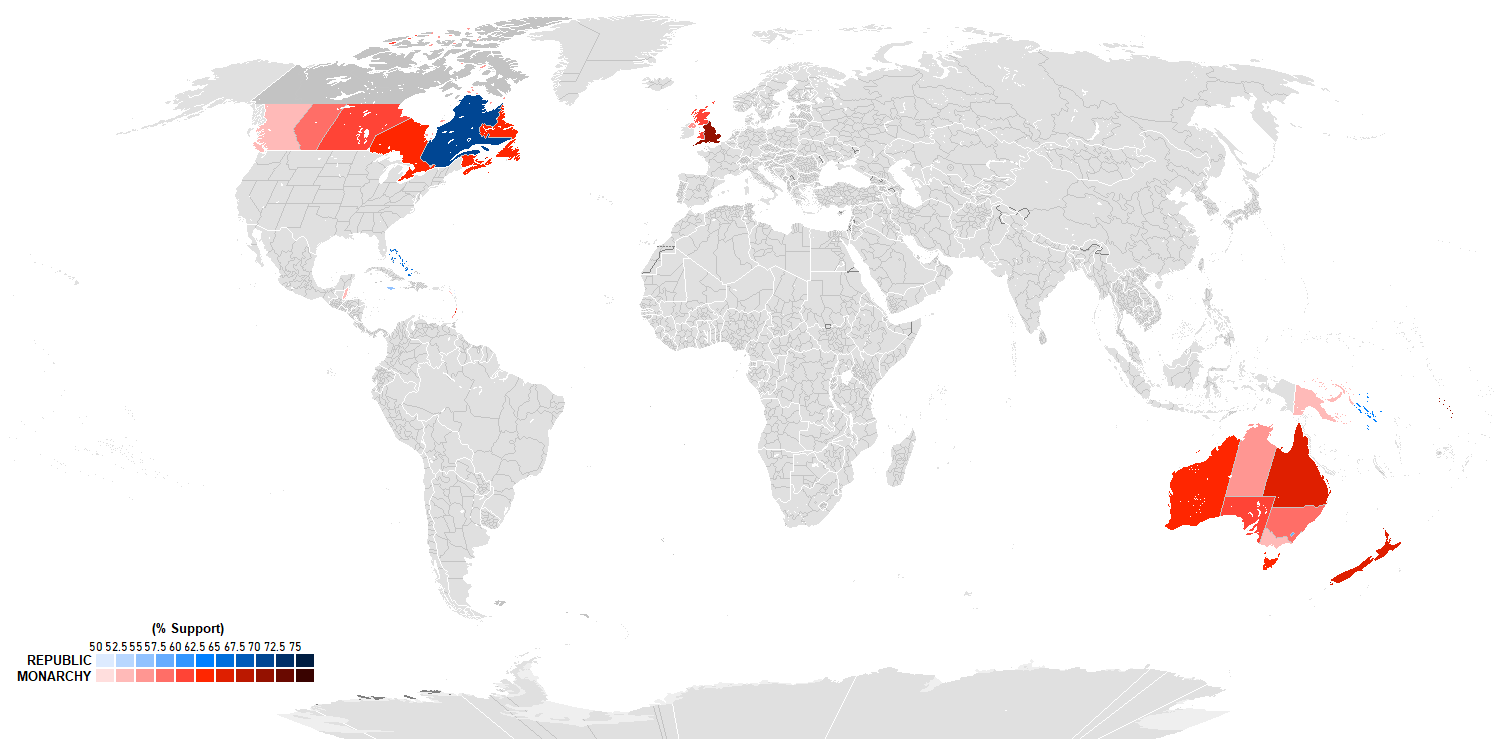
King Charles III is technically head of state in 15 countries beyond the UK – an odd leftover from the British Empire. Reddit user Known_Bobcat_1522 gathered polling data from these nations and mapped the results.
England leads at 76% for the monarchy. Tuvalu in the Pacific comes in second at 73%. On the other end, Quebec shows 70% wanting a republic, way off from other Canadian provinces where the Atlantic region hits 64% for monarchy. The Bahamas registers 65% republican and Jamaica 55%. Ashcroft’s research noted that slavery and colonialism shaped how Caribbean people view the Crown. The Solomon Islands reaches 63% for a republic, but nearby Tuvalu goes the opposite direction.
In Australia, every state leans toward monarchy except the Capital Territory at 59% republican.
Barbados became a republic in 2021. Other Caribbean governments have started discussing whether to do the same. One curious finding: most people said they’d stay in the Commonwealth even as republics. The Commonwealth itself seems more popular than the monarchy.
Australian Capital Territory: 41% Monarchy, 59% Republic
New Zealand: 67% Monarchy, 33% Republic
Papua New Guinea: 53% Monarchy, 47% Republic
Solomon Islands: 37% Monarchy, 63% Republic
Tuvalu: 73% Monarchy, 27% Republic
Belize: 53% Monarchy, 47% Republic
Jamaica: 45% Monarchy, 55% Republic
Bahamas: 35% Monarchy, 65% Republic
St Kitts & Nevis: 54% Monarchy, 46% Republic
Antigua & Barbuda: 49% Monarchy, 51% Republic
St Lucia: 59% Monarchy, 41% Republic
St Vincent & the Grenadines: 65% Monarchy, 35% Republic
Grenada: 57% Monarchy, 43% Republic
Countries with deeper British roots usually favor the monarchy more. But plenty of exceptions exist – St. Vincent and the Grenadines backs the monarchy at 65% while neighboring islands don’t. These old arrangements are getting reconsidered as time goes on.
This is not an insightful map, sorry. It is obvious without needing a map, that England is the most English; and Quebec is the least English (being literally French). You should consider plotting the sentiment gradient in *non* and ex Commonwealth countries to reveal something more interesting and less confounded. As it is this is a Nope for me.


This is not an insightful map, sorry. It is obvious without needing a map, that England is the most English; and Quebec is the least English (being literally French). You should consider plotting the sentiment gradient in *non* and ex Commonwealth countries to reveal something more interesting and less confounded. As it is this is a Nope for me.