The United States and Canada are both federal countries, meaning they have a division of powers between a central government and smaller political units, such as states or provinces. In the United States, there are 50 states, each with its own government and varying degrees of autonomy. Some states, like California and Texas, have large economies and populations, while others, like Wyoming and Vermont, are smaller in both regards.
Canada is divided into 10 provinces and 3 territories. Provinces have significant powers over areas such as healthcare, education, and transportation, while territories have more limited powers delegated to them by the federal government. Provinces like Ontario and Quebec are populous and economically significant, while others, like Prince Edward Island and the territories, have smaller populations and economies.
In terms of contributions and receipts, some states and provinces contribute more to the overall economy of their respective countries than others. For example, states like California, Texas, and New York contribute significantly to the GDP of the United States, while provinces like Ontario, Quebec, and Alberta are major contributors to Canada’s GDP. These regions often have diverse economies, including sectors like technology, finance, and natural resources.
On the other hand, some states and provinces receive more in federal transfers or assistance than they contribute. Factors such as population size, economic activity, and geographic location can influence the flow of funds between different regions. For example, states in the American Midwest often receive agricultural subsidies, while provinces in Canada’s North receive funding for infrastructure and social programs because of their smaller populations and harsher climates.
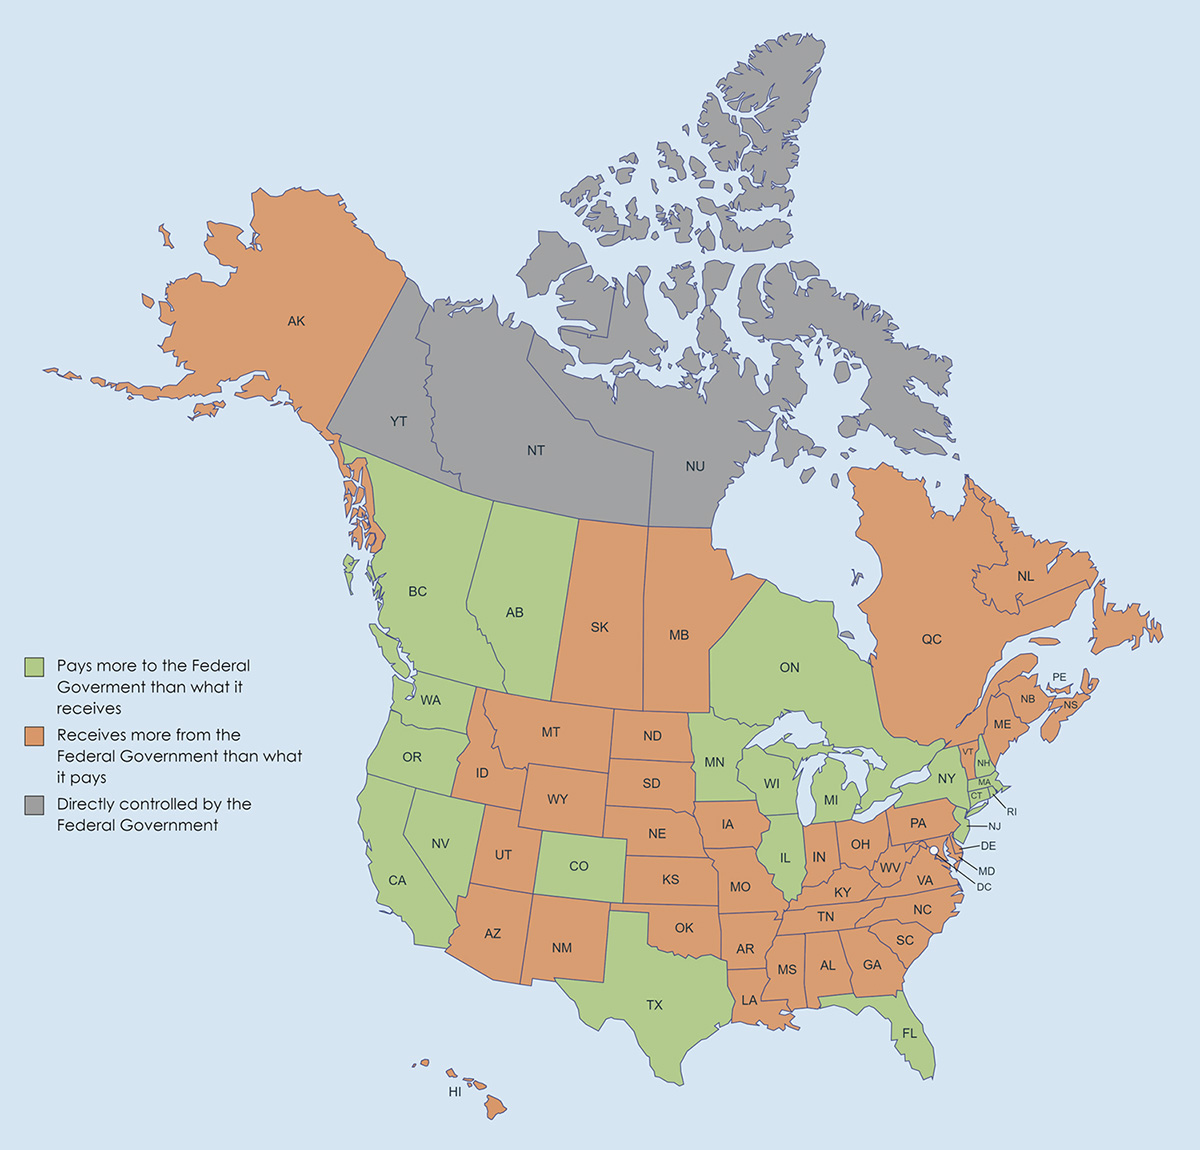
The map below shows contributors and receivers of the United States and Canada.
Here are the top 10 of the major donor U.S. states, characterized by the ratio of federal spending received to federal taxes paid.
Rank
States
Federal Spending Received per Dollar of Taxes Paid
1
~0.74
2
Connecticut
~0.82
3
Massachusetts
~0.83
4
New Hampshire
~0.86
5
Minnesota
~0.88
6
Illinois
~0.94
7
Colorado
~0.97
8
California
~0.99
9
New York
~1.02
10
Washington
~1.02
The list of major recipient U.S. states, characterized by the ratio of federal spending received to federal taxes paid, is as follows:
Rank
States
Federal Spending Received per Dollar of Taxes Paid
1
New Mexico
~2.35
2
Mississippi
~2.11
3
Alaska
~1.87
4
West Virginia
~1.82
5
Alabama
~1.71
6
South Carolina
~1.71
7
Montana
~1.64
8
Kentucky
~1.61
9
Oklahoma
~1.57
10
Louisiana
~1.54
In Canada, the concept of provinces and territories paying more in federal taxes than they receive back in federal spending is not as straightforward as in the United States, primarily due to the nature of the Canadian federal system and the distribution of revenues and expenditures. However, some provinces are considered net contributors to the federal budget, meaning they contribute more in taxes than they receive in federal transfers.
Provinces such as Alberta, Saskatchewan, and Newfoundland and Labrador are often cited as net contributors to the federal government. These provinces have significant natural resource industries, which generate substantial tax revenue.
Provinces and territories that are often cited as net recipients of federal funds include: Prince Edward Island, New Brunswick, Nova Scotia, Manitoba.
Searching for a North America map? Explore these map posters.


")

