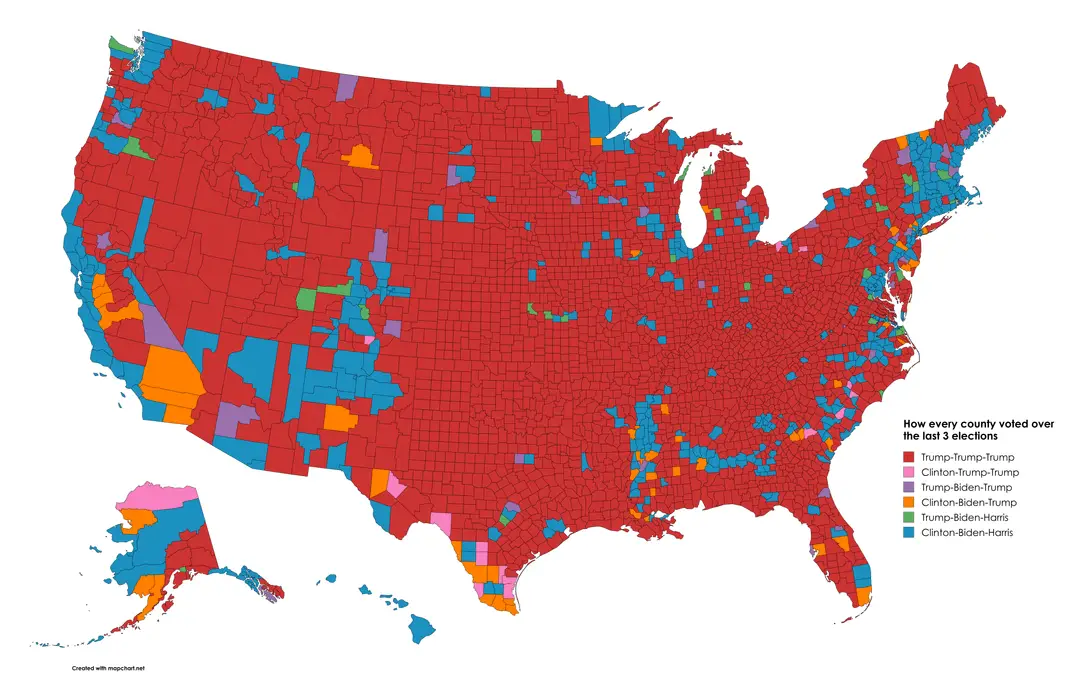
A fascinating map created by Reddit user Mission-Guidance4782 shows how every U.S. county voted in the last three presidential elections. The visualization reveals notable patterns, particularly the stronghold of Trump-supporting counties, many of which consistently voted for Trump across all three elections.
Interestingly, certain voting combinations, such as Clinton-Trump-Harris or Trump-Trump-Harris, are entirely absent from the map. This suggests that Kamala Harris, as a Democratic candidate in the most recent election represented, failed to flip counties that had consistently supported Trump in previous elections. The map also highlights regional stability, with many counties showing little change over time, while swing counties that shifted between parties provide insight into key battleground areas.
This map underscores the enduring political divides in the United States and reflects how entrenched loyalties, as well as shifts in voter turnout, continue to shape electoral outcomes.
If you find this map as fascinating as I did, share your thoughts below. Are there trends you expected to see but didn’t? Let’s discuss!


")