Whether you were born in the city, commute there for work, or are exploring somewhere new for a few days, the hustle and bustle often mean busier roads and more traffic. As the weight of vehicles drives over weak spots in the road, the tarmac breaks down and creates a pothole.
With potholes come flat tires, scraped rims, and wheel misalignment – all good reasons to complain to the local government about the state of the roads. But which cities and towns across the U.S. and the U.K. take to Twitter to complain about their roads the most?
The Clunker Junker team used Twitter API to extract tweets from the U.K. and the U.S., including the terms ‘pothole’ and ‘potholes’ (in total 30,979 tweets) and extrapolated the data to calculate the number of tweets over a year.
The team then used the osm-road-length package based on Overpass API to discover road length for every city and every region in the research. Calculating the length of the roads, the team included the following types of roads, according to OpenStreetMap classification.
motorway
trunk
primary
secondary
tertiary
unclassified
residential
motorway_link
trunk_link
primary_link
secondary_link
tertiary_link
living_street
road
Finally, The Clunker Junker then calculated the number of complaints per 1,000km of road.
To calculate the data for England counties, the team merged the City of London and Greater London. The data was collected in August-September 2021
The maps below reveal the pothole hotspots of the U.S. and the U.K.
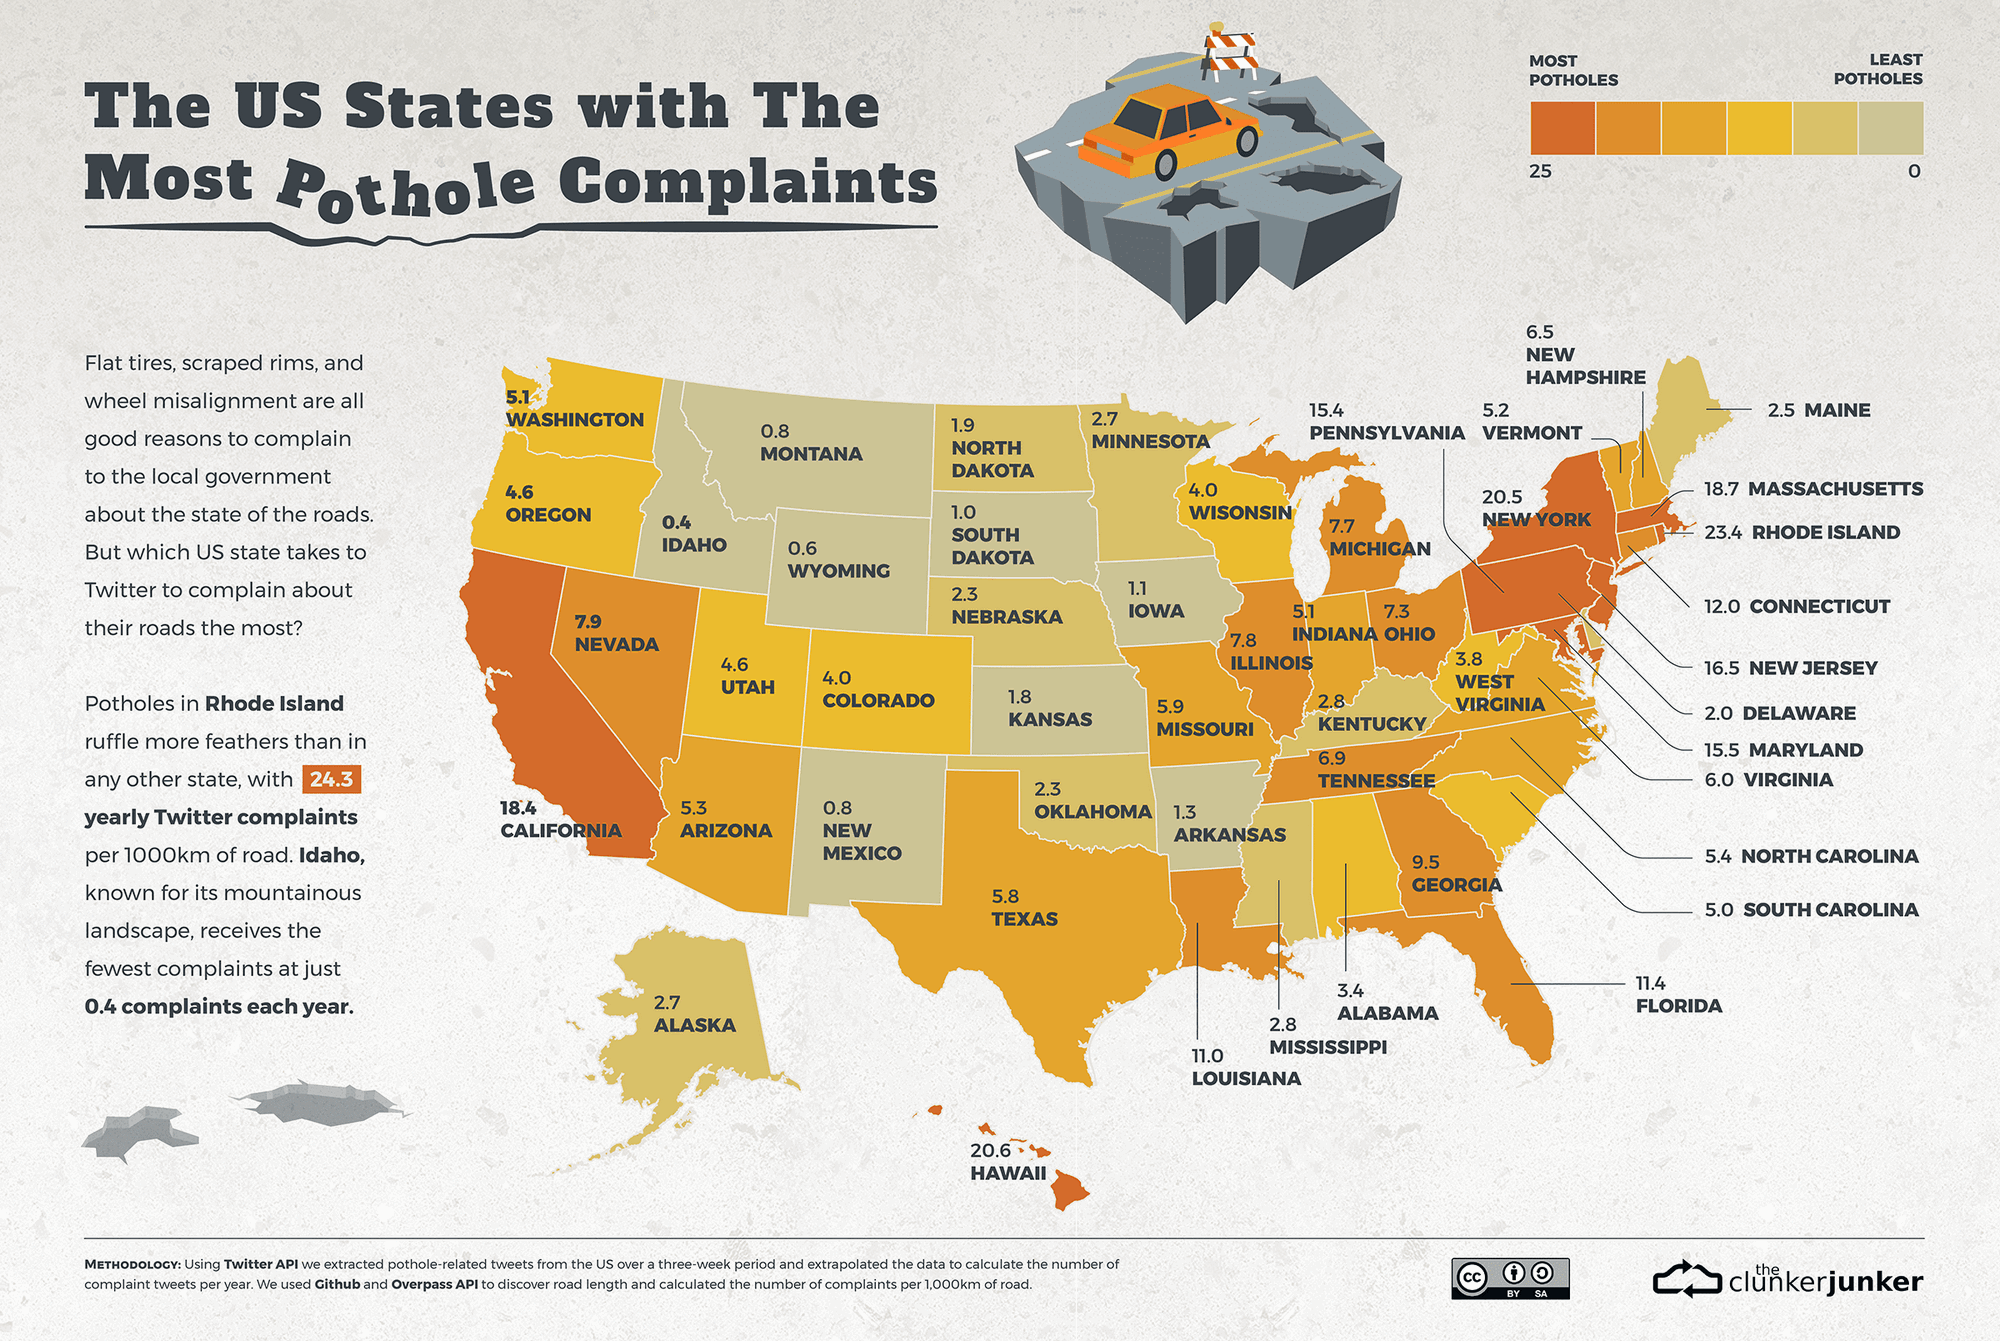
The U.S. States with the most Pothole Complaints
Driving in the United States is often pictured as open highways, but it might look more like gridlock traffic in the day-to-day. According to Finance Online, there were 286.9 million registered vehicles in the U.S. as of 2020 – that’s a whole lotta wheels tearing up the roads.
State
Number of tweets
Road Length (km)
Number of complaints per 1000km of road yearly
Rhode Island
268
11475
23.355119825708
Hawaii
220
10695
20.5703599813
New York
4559
222432
20.496151632859
Massachusetts
1309
69878
18.732648329946
California
5314
288096
18.445240475397
New Jersey
1281
77817
16.461698600563
Maryland
1109
71356
15.541790459106
Pennsylvania
3823
247458
15.449086309596
Connecticut
497
41576
11.95401192996
Florida
3173
277868
11.419091079217
Louisiana
1711
155309
11.016747258691
Georgia
2590
271931
9.5244749587211
Nevada
440
55798
7.8855872970357
Illinois
2083
268575
7.7557479288839
Michigan
1806
233412
7.7373913937587
Ohio
1663
228382
7.281659675456
Tennessee
1319
190302
6.9310884804153
New Hampshire
239
36918
6.4738068151037
Virginia
1090
181425
6.0079922833127
Missouri
1567
267648
5.8547046867527
Texas
4951
852383
5.8084218009979
North Carolina
1328
244623
5.4287618089877
Arizona
774
144825
5.3443811496634
Vermont
162
31349
5.1676289514817
Indiana
946
185158
5.1091500232234
Washington
822
162634
5.0542936901263
South Carolina
765
153358
4.9883279646318
Utah
325
71046
4.5745010275033
Oregon
621
135978
4.5669152362882
Colorado
707
175364
4.0316142423759
Wisconsin
851
214249
3.97201387171
West Virginia
325
85696
3.7924757281553
Alabama
669
198849
3.3643619027503
Kentucky
440
157565
2.7924983340209
Mississippi
449
161014
2.7885773907859
Alaska
76
28205
2.694557702535
Minnesota
698
263003
2.6539621221051
Maine
162
64873
2.4971868111541
Nebraska
392
168698
2.3236790003438
Oklahoma
535
233623
2.2900142537336
Delaware
29
14288
2.0296752519597
North Dakota
239
125549
1.9036392165609
Kansas
449
249862
1.7969919395506
Arkansas
229
178647
1.2818575178984
Iowa
220
207464
1.0604249411946
South Dakota
143
146307
0.97739684362334
New Mexico
172
210801
0.81593540827605
Montana
124
162673
0.76226540360109
Wyoming
48
77385
0.62027524714092
Idaho
57
143199
0.39804747239855
Which cities get the most pothole complaints?
The U.S. cities with the most and least pothole complaints
Atlanta is revealed as the pothole capital, receiving 529.1 yearly Twitter complaints per 1000 km of road. The independent city of Chesapeake, however, receives just 3.8 complaints each year.
City
State
Number of tweets
Road Length (km)
Number of complaints per 1000km of road yearly
Atlanta
Georgia
1825
3449
529.13888083502
Washington
District of Columbia
975
2160
451.38888888889
St. Louis
Missouri
812
2108
385.19924098672
New Orleans
Louisiana
1042
3212
324.40846824408
Miami
Florida
526
1695
310.32448377581
Pittsburgh
Pennsylvania
631
2077
303.80356283101
Boston
Massachusetts
564
1860
303.22580645161
New York
New York
3278
11691
280.38662218801
Philadelphia
Pennsylvania
1338
5027
266.16272130495
Buffalo
New York
268
1263
212.19319081552
Baltimore
Maryland
535
2603
205.53207837111
Chicago
Illinois
1491
7821
190.64058304565
San Francisco
California
354
1991
177.80010045203
Quincy
Massachusetts
67
437
153.3180778032
Syracuse
New York
124
854
145.19906323185
Oakland
California
258
1979
130.36887316827
Seattle
Washington
401
3126
128.27895073576
Alexandria
Virginia
67
533
125.70356472795
Tampa
Florida
401
3301
121.478339897
Minneapolis
Minnesota
229
2038
112.36506378803
Richmond
Virginia
210
1893
110.93502377179
Portland
Oregon
440
4034
109.07288051562
Providence
Rhode Island
96
882
108.84353741497
Salt Lake City
Utah
162
1565
103.51437699681
Ann Arbor
Michigan
76
753
100.92961487384
Jersey City
New Jersey
48
489
98.159509202454
Rochester
New York
115
1230
93.49593495935
Cincinnati
Ohio
191
2093
91.256569517439
Newark
New Jersey
86
962
89.397089397089
Los Angeles
California
1223
13879
88.118740543267
Milwaukee
Wisconsin
306
3557
86.027551307281
Cleveland
Ohio
210
2527
83.102493074792
Berkeley
California
38
462
82.251082251082
Detroit
Michigan
459
5675
80.881057268722
Fort Lauderdale
Florida
96
1205
79.668049792531
Long Beach
California
143
1815
78.787878787879
Elizabeth
New Jersey
29
371
78.167115902965
Orlando
Florida
172
2259
76.139884904825
Dallas
Texas
698
9530
73.242392444911
Honolulu
Hawaii
105
1448
72.513812154696
Corpus Christi
Texas
220
3139
70.086014654349
Birmingham
Alabama
258
3776
68.326271186441
West Palm Beach
Florida
57
844
67.535545023697
New Haven
Connecticut
38
567
67.019400352734
Cambridge
Massachusetts
19
285
66.666666666667
Houston
Texas
1080
16358
66.022741166402
Jackson
Mississippi
143
2261
63.246351172048
Gainesville
Florida
67
1066
62.851782363977
Kansas City
Missouri
392
6242
62.80038449215
Las Vegas
Nevada
277
4675
59.251336898396
Austin
Texas
382
6646
57.478182365333
Boulder
Colorado
38
685
55.474452554745
Columbia
South Carolina
134
2520
53.174603174603
Baton Rouge
Louisiana
124
2380
52.100840336134
Inglewood
California
19
365
52.054794520548
San Diego
California
382
7538
50.676572035023
Saint Paul
Minnesota
86
1744
49.311926605505
Indianapolis
Indiana
411
8383
49.0277943457
Manchester
New Hampshire
38
783
48.5312899106
Paterson
New Jersey
19
396
47.979797979798
Lafayette
Louisiana
86
1832
46.943231441048
Wilmington
North Carolina
57
1252
45.527156549521
College Station
Texas
48
1057
45.411542100284
Nashville
Tennessee
296
6569
45.060130917948
Plano
Texas
96
2191
43.815609310817
Memphis
Tennessee
268
6143
43.626892397851
Springfield
Missouri
86
1981
43.412417970722
Glendale
California
29
684
42.397660818713
Grand Rapids
Michigan
57
1365
41.758241758242
South Bend
Indiana
48
1185
40.506329113924
Hartford
Connecticut
19
471
40.339702760085
Lowell
Massachusetts
19
476
39.915966386555
Omaha
Nebraska
162
4060
39.901477832512
Toledo
Ohio
86
2260
38.053097345133
Lansing
Michigan
38
1001
37.962037962038
Pasadena
California
29
769
37.711313394018
Akron
Ohio
67
1788
37.472035794183
Denver
Colorado
162
4329
37.422037422037
Lincoln
Nebraska
96
2595
36.994219653179
Green Bay
Wisconsin
38
1037
36.644165863067
Dayton
Ohio
57
1575
36.190476190476
St. Petersburg
Florida
76
2252
33.747779751332
Tempe
Arizona
38
1146
33.158813263525
New Bedford
Massachusetts
19
574
33.101045296167
Charlotte
North Carolina
229
6962
32.89284688308
Tallahassee
Florida
57
1821
31.301482701812
Raleigh
North Carolina
115
3751
30.658491069048
Columbus
Ohio
201
6698
30.00895789788
Charleston
South Carolina
57
1948
29.260780287474
Pompano Beach
Florida
19
672
28.27380952381
Mobile
Alabama
67
2371
28.258118937157
Murrieta
California
19
705
26.950354609929
Lexington
Kentucky
86
3199
26.883401062832
Chattanooga
Tennessee
76
2830
26.855123674912
Stamford
Connecticut
19
737
25.780189959294
Roanoke
Virginia
29
1128
25.709219858156
Yonkers
New York
19
746
25.469168900804
Chico
California
19
763
24.901703800786
Tucson
Arizona
115
4665
24.65166130761
Fargo
North Dakota
29
1182
24.534686971235
San Antonio
Texas
277
11432
24.230230930721
El Paso
Texas
124
5454
22.735606894023
Sioux Falls
South Dakota
38
1683
22.578728461081
Little Rock
Arkansas
57
2525
22.574257425743
Vallejo
California
19
847
22.432113341204
Phoenix
Arizona
239
10701
22.334361274647
Fayetteville
North Carolina
48
2186
21.95791399817
Fort Collins
Colorado
29
1322
21.936459909228
Tacoma
Washington
38
1761
21.578648495173
San Jose
California
105
4900
21.428571428571
Eugene
Oregon
29
1354
21.418020679468
Louisville
Kentucky
143
6835
20.921726408193
Independence
Missouri
29
1392
20.833333333333
Savannah
Georgia
38
1836
20.697167755991
Edinburg
Texas
19
933
20.364415862808
Odessa
Texas
29
1468
19.754768392371
Costa Mesa
California
10
513
19.493177387914
Worcester
Massachusetts
19
994
19.114688128773
Beaumont
Texas
29
1518
19.104084321476
Topeka
Kansas
29
1538
18.855656697009
Bellevue
Washington
19
1012
18.774703557312
Brockton
Massachusetts
10
534
18.7265917603
Spokane
Washington
38
2039
18.63658656204
Sacramento
California
57
3133
18.193424832429
Colorado Springs
Colorado
76
4245
17.903415783274
Ontario
California
19
1076
17.657992565056
Mesa
Arizona
67
3836
17.466110531804
Norfolk
Virginia
29
1677
17.292784734645
Salinas
California
10
606
16.501650165016
Naperville
Illinois
19
1154
16.464471403813
Sunnyvale
California
10
634
15.772870662461
Rockford
Illinois
29
1850
15.675675675676
Allentown
Pennsylvania
10
639
15.649452269171
Wichita
Kansas
67
4301
15.577772611021
Waterbury
Connecticut
10
669
14.947683109118
Tulsa
Oklahoma
67
4486
14.935354436023
Greensboro
North Carolina
48
3274
14.660965180208
Murfreesboro
Tennessee
29
1986
14.60221550856
Antioch
California
10
686
14.577259475219
Huntsville
Alabama
48
3321
14.453477868112
Chula Vista
California
19
1317
14.426727410782
Miami Gardens
Florida
10
694
14.409221902017
Everett
Washington
10
729
13.717421124829
Knoxville
Tennessee
48
3510
13.675213675214
Pomona
California
10
733
13.642564802183
Reno
Nevada
29
2128
13.627819548872
Fort Worth
Texas
124
9113
13.606935147591
Oklahoma City
Oklahoma
124
9198
13.481191563383
Simi Valley
California
10
752
13.297872340426
Virginia Beach
Virginia
48
3639
13.190436933223
Albuquerque
New Mexico
67
5098
13.14240878776
Allen
Texas
10
780
12.820512820513
Lubbock
Texas
38
3001
12.662445851383
Temecula
California
10
801
12.484394506866
Cedar Rapids
Iowa
19
1555
12.218649517685
Fremont
California
19
1565
12.140575079872
Clarksville
Tennessee
19
1587
11.972274732199
Cary
North Carolina
19
1661
11.438892233594
Hollywood
Florida
10
889
11.248593925759
Carlsbad
California
10
910
10.989010989011
Huntington Beach
California
10
939
10.649627263046
Frisco
Texas
19
1785
10.644257703081
Macon
Georgia
29
2750
10.545454545455
Shreveport
Louisiana
29
2808
10.327635327635
Anchorage
Alaska
29
2834
10.232886379675
Overland Park
Kansas
19
1898
10.010537407798
Pembroke Pines
Florida
10
1009
9.9108027750248
Waco
Texas
19
1919
9.9009900990099
Spokane Valley
Washington
10
1026
9.7465886939571
Warren
Michigan
10
1065
9.3896713615023
Oceanside
California
10
1073
9.3196644920783
Gilbert
Arizona
19
2050
9.2682926829268
Davenport
Iowa
10
1083
9.2336103416436
Chandler
Arizona
19
2114
8.9877010406812
Clearwater
Florida
10
1113
8.984725965858
Pueblo
Colorado
10
1177
8.4961767204758
Bakersfield
California
29
3428
8.4597432905484
Peoria
Illinois
29
3514
8.252703471827
Santa Rosa
California
10
1225
8.1632653061224
Lakeland
Florida
10
1320
7.5757575757576
Evansville
Indiana
10
1322
7.5642965204236
Henderson
Nevada
19
2520
7.5396825396825
Fort Wayne
Indiana
19
2530
7.5098814229249
Jacksonville
Florida
67
9318
7.1903842026186
McAllen
Texas
10
1400
7.1428571428571
North Charleston
South Carolina
10
1430
6.993006993007
Newport News
Virginia
10
1433
6.9783670621075
Fresno
California
29
4366
6.6422354557948
Scottsdale
Arizona
19
3028
6.2747688243065
Denton
Texas
57
9229
6.1761837685556
Palm Bay
Florida
10
1658
6.0313630880579
Grand Prairie
Texas
10
1719
5.8173356602676
Garland
Texas
10
1720
5.8139534883721
Norman
Oklahoma
10
1730
5.7803468208092
North Las Vegas
Nevada
10
1774
5.6369785794814
McKinney
Texas
10
1793
5.5772448410485
Des Moines
Iowa
10
1836
5.4466230936819
Irvine
California
10
1884
5.307855626327
Stockton
California
10
2018
4.9554013875124
Boise
Idaho
10
2151
4.6490004649
Laredo
Texas
10
2184
4.5787545787546
Chesapeake
Virginia
10
2648
3.7764350453172
The English Counties with The Most Pothole Complaints
With an average annual rainfall of 1,374 mm, the United Kingdom is no stranger to potholes. But which counties complain about the most? Great London receives 176.7 yearly Twitter complaints per 1000 kilometers of the road (despite being known as the “rainy city,” Manchester comes in second place), whereas Northumberland doesn’t receive any.
County
Number of tweets
Road Length (m)
Number of complaints per 1000km of road yearly
Greater London
2991
16925
176.7208
Greater Manchester
946
10818
87.44685
Bristol
105
1365
76.92308
Staffordshire
602
8881
67.78516
Cambridgeshire
335
6050
55.3719
Berkshire
258
5288
48.78971
Nottinghamshire
248
6603
37.55869
Merseyside
220
6029
36.4903
West Yorkshire
373
10834
34.42865
Hampshire
401
12331
32.51967
East Sussex
153
4997
30.61837
West Midlands
277
9309
29.75615
Tyne and Wear
143
5163
27.69708
Buckinghamshire
115
4405
26.1067
Essex
268
11359
23.59363
Bedfordshire
86
3841
22.39
North Yorkshire
287
13604
21.09674
Oxfordshire
134
6422
20.86577
Cheshire
162
8456
19.15799
Durham
86
4614
18.63893
Suffolk
143
8491
16.84136
East Riding of Yorkshire
86
5163
16.65698
Lancashire
153
9557
16.00921
Shropshire
124
8478
14.62609
Lincolnshire
191
13329
14.32966
Derbyshire
105
7442
14.10911
Worcestershire
76
5587
13.60301
West Sussex
76
5693
13.34973
Rutland
10
774
12.9199
Surrey
86
6889
12.48367
Wiltshire
86
7199
11.9461
Hertfordshire
76
6412
11.85278
Dorset
76
6545
11.61192
Leicestershire
76
6898
11.01769
South Yorkshire
76
6909
11.00014
Northamptonshire
67
6336
10.57449
Isle of Wight
10
991
10.09082
Kent
124
12351
10.03967
Warwickshire
57
5798
9.830976
Devon
162
17075
9.487555
Gloucestershire
67
7074
9.471303
Somerset
76
10918
6.960982
Cumbria
57
9756
5.842558
Norfolk
57
11336
5.028229
Herefordshire
10
4584
2.181501
Cornwall
10
10288
0.972006
Northumberland
0
6764
0
The U.K. cities with the most and least pothole complaints
Whether you were born in the city, commute for work, or explore somewhere new for a few days, the hustle often means busier roads and more traffic. As heavy vehicles drive over weak spots in the road, the tarmac breaks down and creates a pothole. But which city suffers the most? Edinburgh receives more complaints than anywhere else, with 570.3 yearly Twitter complaints per 1000 km of road – a far cry from Wakefield, which has just 5.4 annual complaints.
City
Region
Number of tweets
Road Length (km)
Number of complaints per 1000km of road yearly
Edinburgh
Scotland
994
1743
570.28112449799
Stoke-on-Trent
England
516
1064
484.96240601504
Cambridge
England
153
370
413.51351351351
Southampton
England
268
659
406.67678300455
Manchester
England
612
1668
366.90647482014
Glasgow
Scotland
812
2266
358.34068843778
Oxford
England
96
409
234.71882640587
Nottingham
England
210
985
213.19796954315
Ely
England
29
152
190.78947368421
Bath
England
57
324
175.92592592593
Chichester
England
19
110
172.72727272727
London
England
2762
16924
163.2001890806
Dundee
Scotland
105
679
154.63917525773
Lincoln
England
48
344
139.53488372093
Inverness
Scotland
38
298
127.51677852349
Ripon
England
10
88
113.63636363636
Portsmouth
England
57
521
109.40499040307
Cardiff
Wales
134
1342
99.850968703428
Worcester
England
38
382
99.476439790576
Belfast
Northern Ireland
124
1271
97.560975609756
Kingston upon Hull
England
86
893
96.304591265398
Plymouth
England
96
1044
91.954022988506
Liverpool
England
153
1684
90.855106888361
Aberdeen
Scotland
115
1291
89.078233927188
Norwich
England
38
473
80.338266384778
Bristol
England
105
1365
76.923076923077
Peterborough
England
96
1267
75.76953433307
Birmingham
England
201
3107
64.692629546186
Leicester
England
57
942
60.509554140127
Newcastle upon Tyne
England
67
1145
58.515283842795
Exeter
England
29
502
57.768924302789
Salford
England
57
1001
56.943056943057
Coventry
England
57
1063
53.621825023518
York
England
48
970
49.484536082474
Canterbury
England
57
1155
49.350649350649
Derby
England
38
890
42.696629213483
Leeds
England
143
3638
39.307311709731
Preston
England
19
807
23.543990086741
Gloucester
England
10
471
21.231422505308
Sheffield
England
38
2238
16.97944593387
Bradford
England
29
2197
13.199817933546
Wolverhampton
England
10
872
11.467889908257
St Albans
England
10
903
11.074197120709
Carlisle
England
19
1880
10.106382978723
Chelmsford
England
10
1225
8.1632653061224
Lancaster
England
10
1268
7.8864353312303
Swansea
Wales
10
1388
7.2046109510086
Wakefield
England
10
1839
5.4377379010332
Key Findings
Rhode Island is the American state with the most pothole tweets per 1,000km of road: 23.4.
Atlanta, Georgia, is the U.S. city with the most complaints, 529.1 per 1,000km.
Greater London is the English county with the most pothole-themed tweets, 176.7 per 1,000km.
Edinburgh is the U.K. city with the most pothole complaints on Twitter, 570.3 per 1,000km.