Weather is the condition of the atmosphere, defining the degree to which it is freezing or warm, dry or humid, still or stormy, clear or cloudy. On our planet, most weather aspects occur in the troposphere. Weather applies to everyday temperature, precipitation, air pressure, moisture, and other atmospheric statuses, whereas climate describes average atmospheric conditions over more extended periods.
Here are the best interactive maps, visualizing the weather in different parts of our planet.
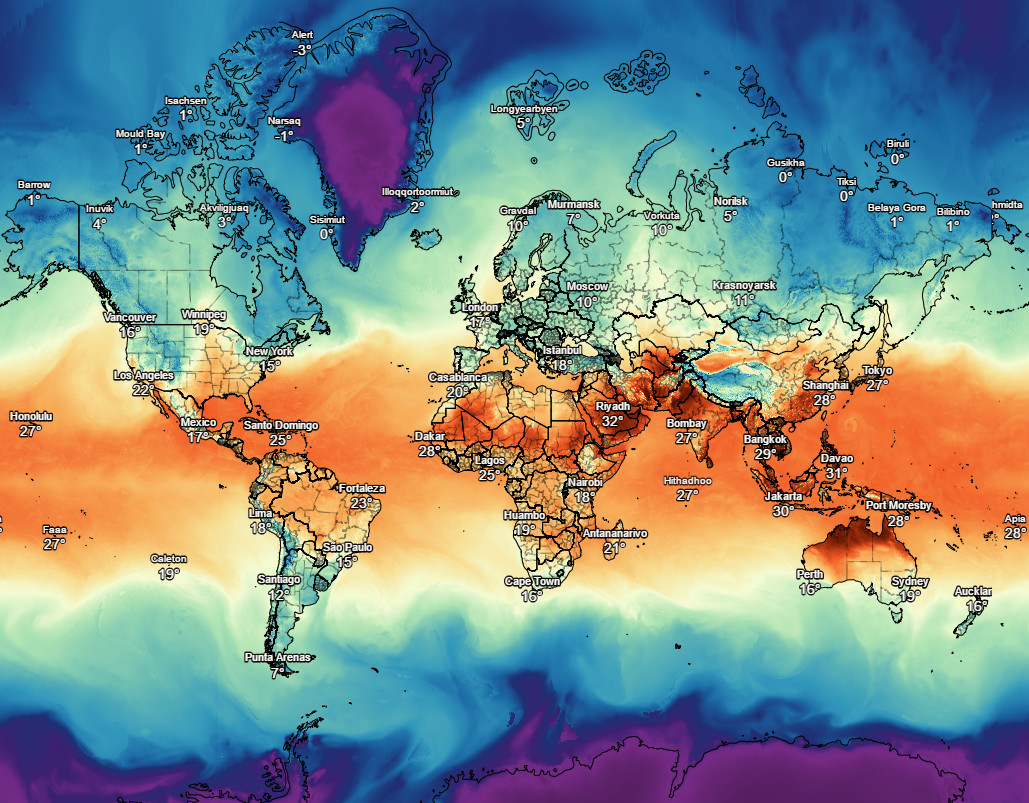
VentuSky
The VentuSky application depicts the relationship of the whole system, representing the сhanges of temperature, precipitation, pressure, wind, cloud cover on the map.
Dark Sky by Apple
The color spectrum is from blue to red. The blue symbolizes a lower value, while the red means a much higher value. The white color intimates a value somewhere in the middle.
Meteo Earth
Meteo Earth is a magnificent 3D weather map. Every forecast 3D map is provided by a MeteoGroup forecast model based on ECMWF-data.
The temperature interactive map displays the forecast air temperature at the selected time 2 meters over the ground.
The wind map reveals the prognosticated wind flow at the chosen altitude, beginning at 10 meters above the ground. Different sizes and colors symbolize wind speed. By hitting on the thermometer symbol, you can also visualize the temperature of the wind current.


?")


