Global linguistic diversity is a fascinating aspect of human culture, reflecting the rich tapestry of languages spoken around the world. Across various countries, there exists a remarkable array of languages, each contributing to the cultural heritage and identity of its speakers.
Countries with the highest linguistic diversity include Papua New Guinea, with over 800 languages spoken, Indonesia, with around 700 languages, and Nigeria, with over 500 languages. These nations boast a vast array of indigenous languages, reflecting the diverse ethnic groups and cultures within their borders.
Rank
Country
Numbe of Languages
1
Papua New Guinea
Over 800 languages
2
Indonesia
Around 700 languages
3
Nigeria
Over 500 languages
4
India
Over 400 languages
5
Cameroon
Over 200 languages
6
Mexico
Over 280 languages
7
Australia
Around 250 languages
8
Brazil
Over 210 languages
9
Democratic Republic of the Congo
Over 200 languages
10
Philippines
Around 185 languages
In terms of the most widely spoken language, Mandarin Chinese holds the title, with over a billion native speakers worldwide. English follows closely behind, with approximately 1.5 billion speakers when including both native and non-native speakers.
On the other end of the spectrum, some languages are spoken by only a handful of individuals, making them highly endangered. These endangered languages are at risk of disappearing entirely, often due to factors such as globalization, cultural assimilation, and linguistic oppression. It’s estimated that a language dies out every two weeks, highlighting the urgent need for language preservation efforts.
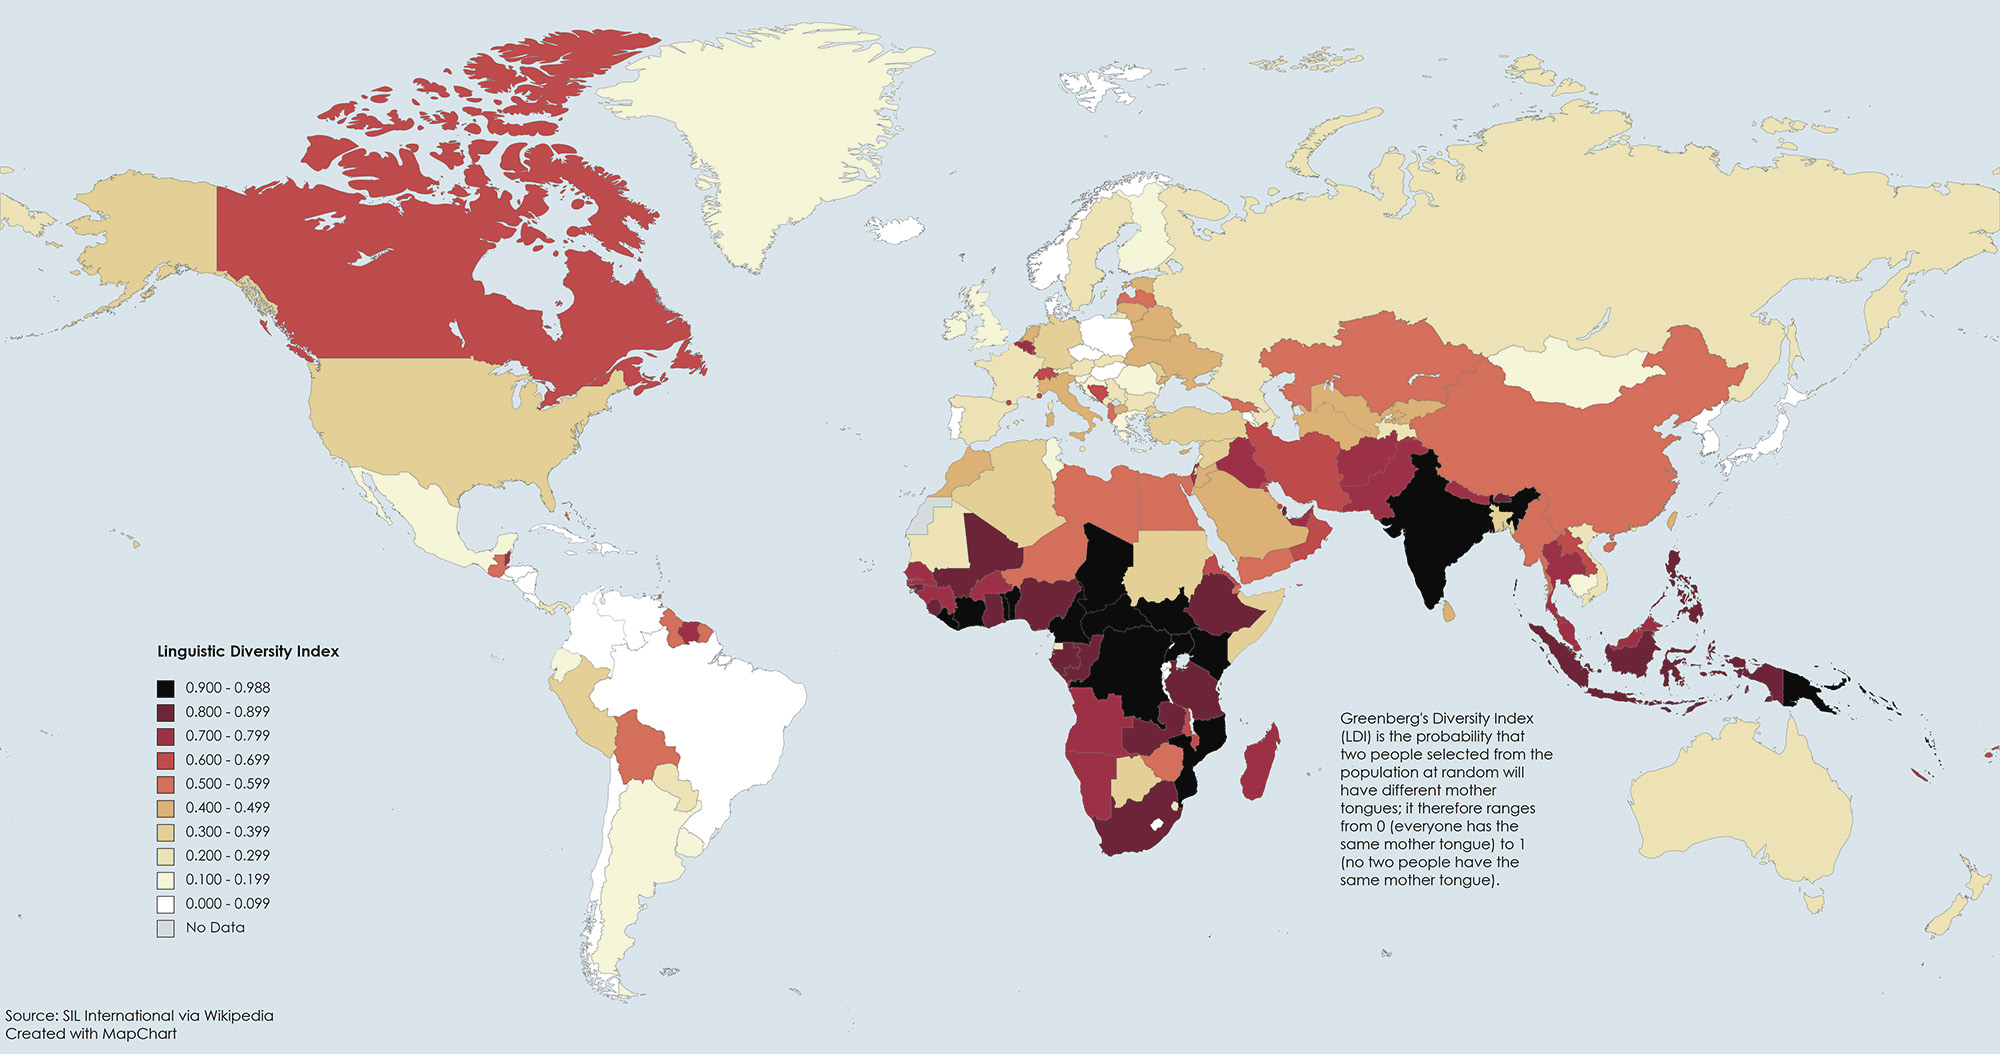
Assessing linguistic diversity involves a multifaceted approach that encompasses various methods and techniques. One common method is counting the number of languages spoken within a particular area or population, providing a basic overview of diversity. Another quantitative measure is Greenberg’s Diversity Index, which calculates the probability that two randomly selected individuals in a population will speak different languages.
The index ranges from 0 to 1, with higher values indicating greater linguistic diversity. A value of 0 indicates complete linguistic homogeneity, where everyone speaks the same language, while a value of 1 indicates maximum diversity, where each individual speaks a different language.
Countries with high linguistic diversity, such as Papua New Guinea, Indonesia, and Nigeria, tend to have higher values of Greenberg’s Diversity Index. This is because these countries are home to numerous indigenous languages spoken by diverse ethnic groups. Factors contributing to this diversity include historical migration patterns, geographic isolation, and cultural fragmentation.
On the other hand, countries with lower linguistic diversity, such as smaller European nations like Iceland or Luxembourg, tend to have lower values of the index. This is often due to factors such as a smaller population size, linguistic assimilation, or historical linguistic standardization efforts.
The world map above shows that many South American countries also have a low Greenberg Diversity Index. For example, Brazil has one of the lowest Greenberg’s Diversity Index scores due to the historical dominance of Portuguese as the official language, which has marginalized indigenous languages. Colonial efforts to standardize Portuguese and suppress indigenous languages, coupled with cultural assimilation and immigration patterns favoring Portuguese, have led to linguistic homogeneity. Additionally, government policies promoting Portuguese as the primary language of education and administration further reinforce this dominance, resulting in a lower overall linguistic diversity index for Brazil.
It’s important to note that Greenberg’s Diversity Index provides a numerical representation of linguistic diversity but may not capture the full complexity of language dynamics within a country. Additionally, changes in population demographics, language policies, and sociopolitical factors can influence the index value over time.
Are you interested in the languages of the world? If so, we advise you to pay attention to the following books.


")


