Allergies are your body’s immune system reacting to a foreign substance, such as pet dander, pollen or shellfish, causing clinical symptoms such coughing or swelling.
According to the National Center for Health Statistics, more than 25% of children in the United States (27.2%) and almost one-third of adults (31.8%) have an allergy. This amounts to more than 100 million people.
Seasonal allergies affect almost five times as many people as food allergies, but they are considerably more difficult to avoid. The severity of indoor and outdoor allergens, such as animal dander and pollen, is affected by both seasons and the local environment. This causes a range of symptoms, from unpleasant to life-threatening: itching, sneezing, and even asthma episodes.
Although allergies cannot be cured, they can be managed, prevented, or treated. Because indoor and outdoor allergies are influenced by environmental factors, one method of prevention is simply being in the right location at the right time.
Recognizing this, HouseFresh analyzed allergen data and local environmental statistics to determine which U.S. cities and states have the most and least severe indoor and outdoor allergies.
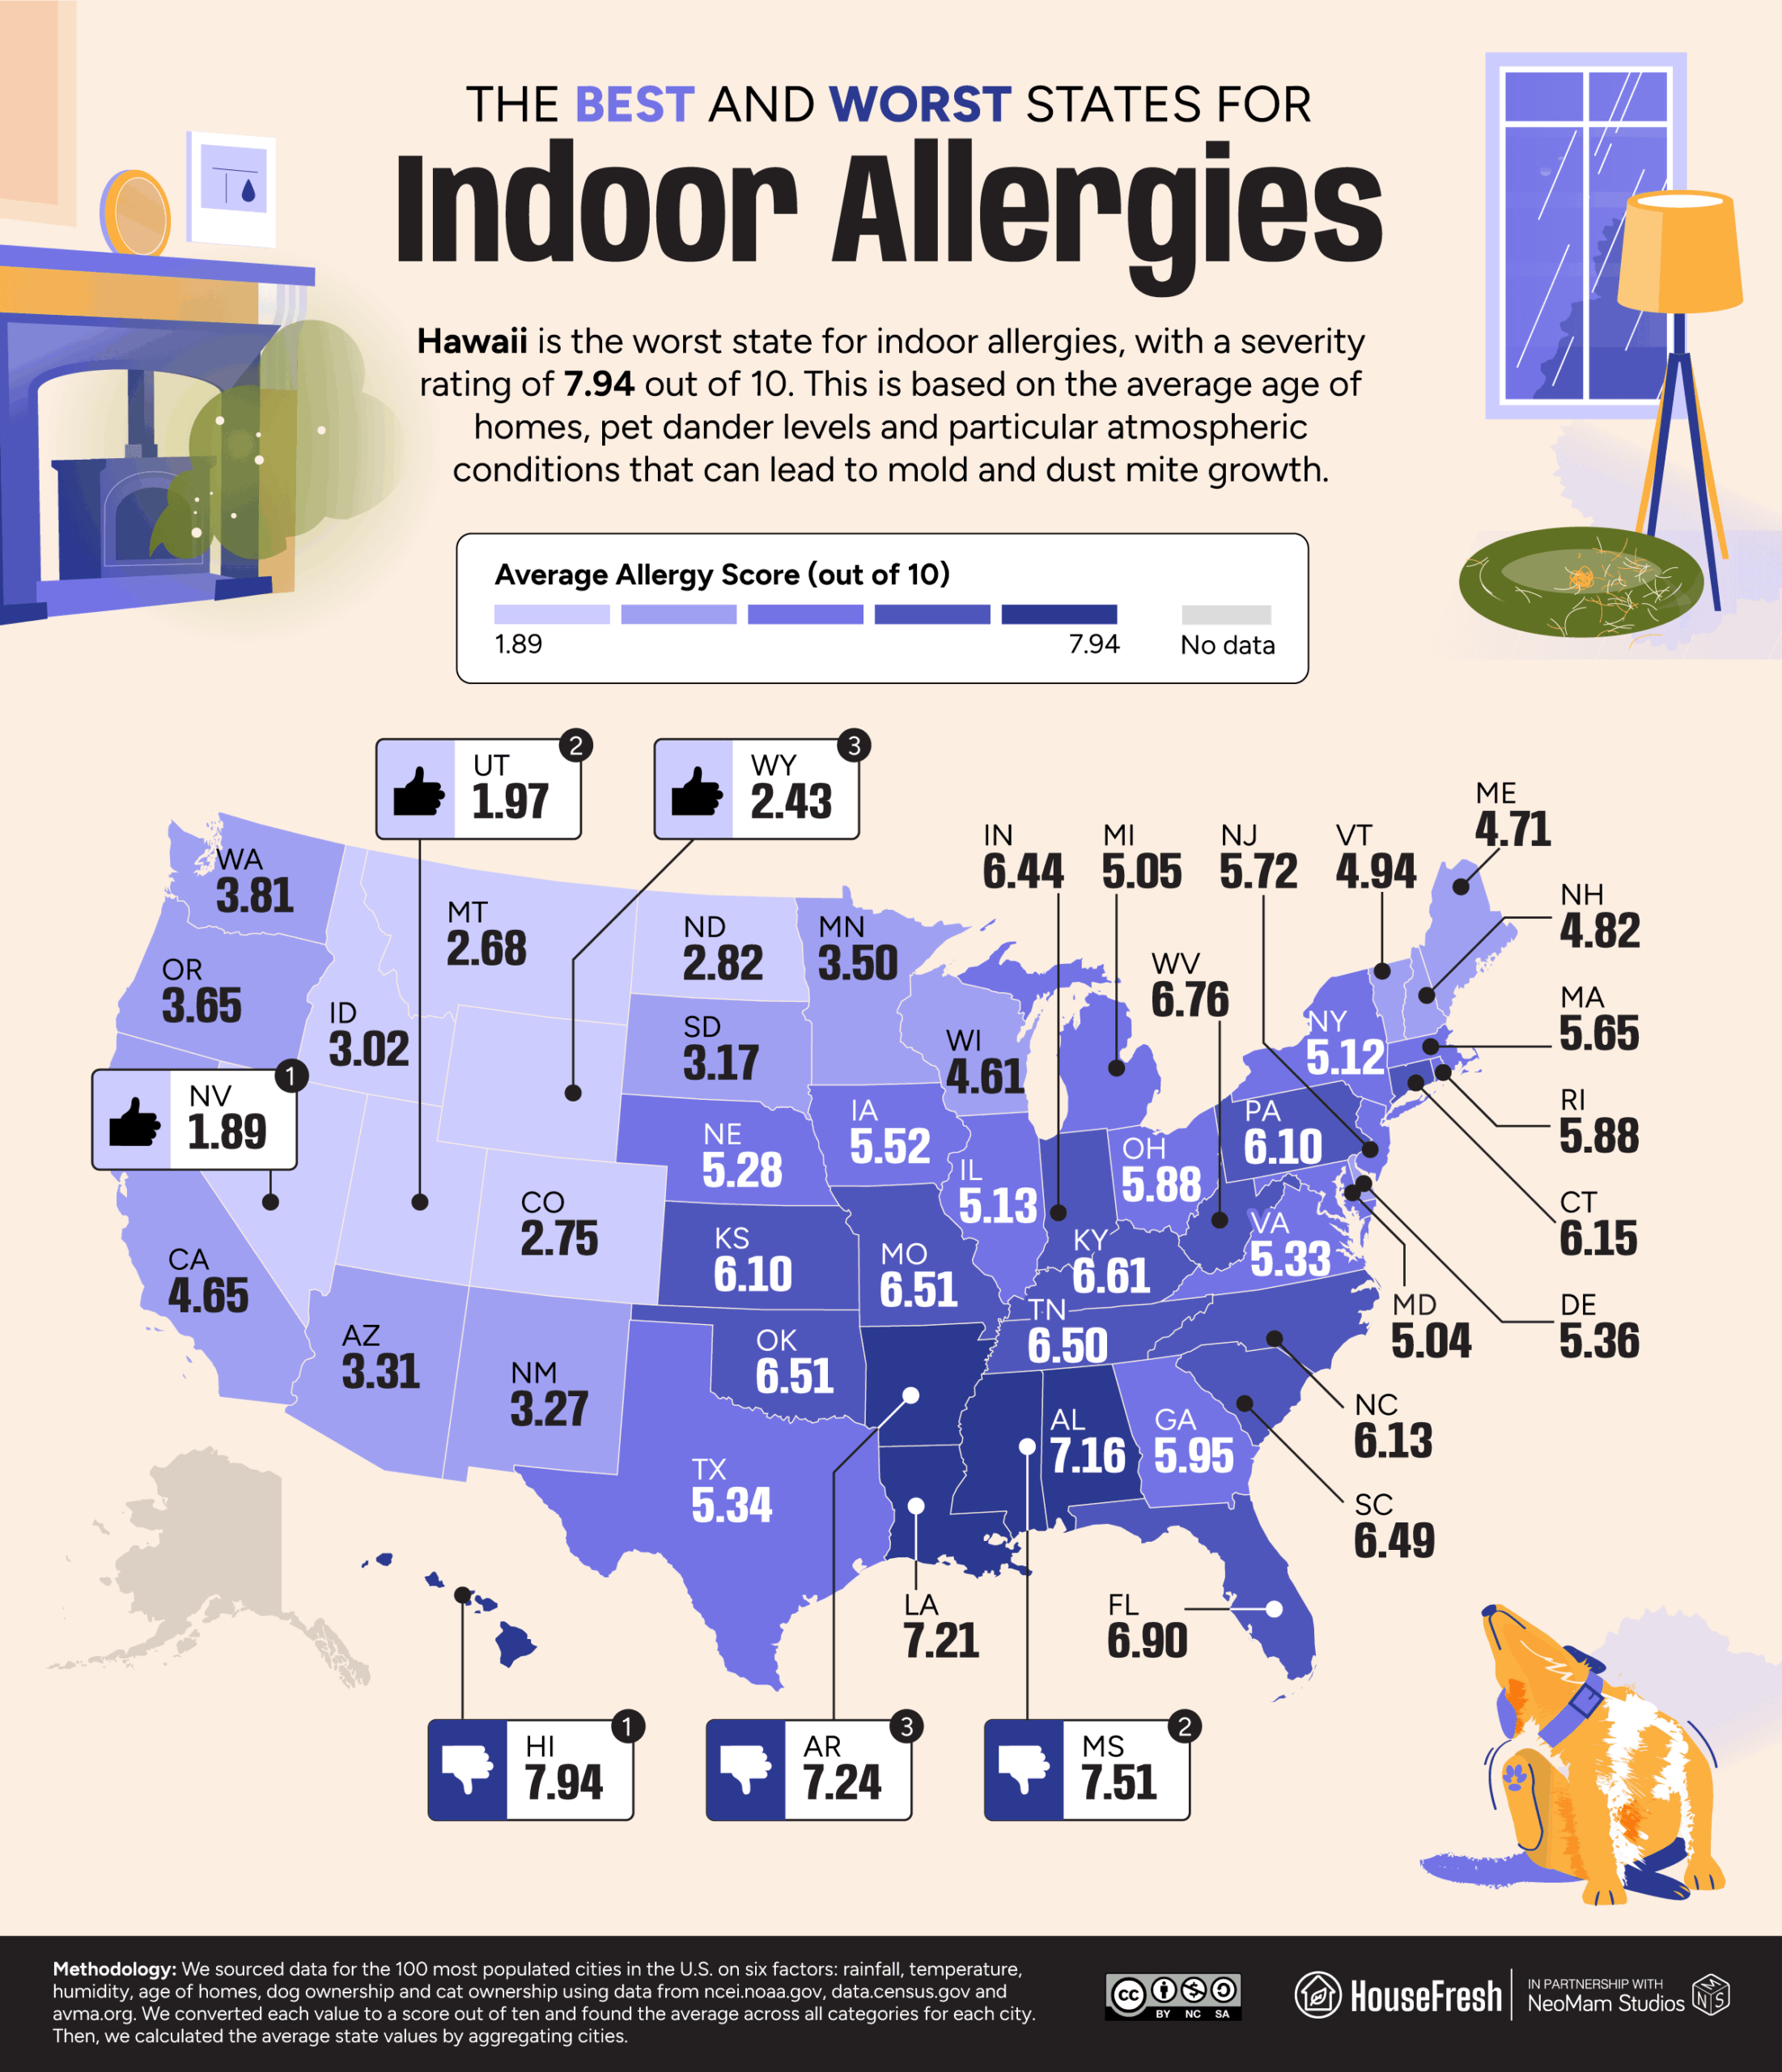
Hawaii is the worst state for indoor allergens, with an average severity rating of 7.94 out of 10 across five indoor allergy variables.
Laredo (Texas) has the worst outdoor allergies (9.11), while Jackson (Mississippi) has the worst interior allergies (8.33).
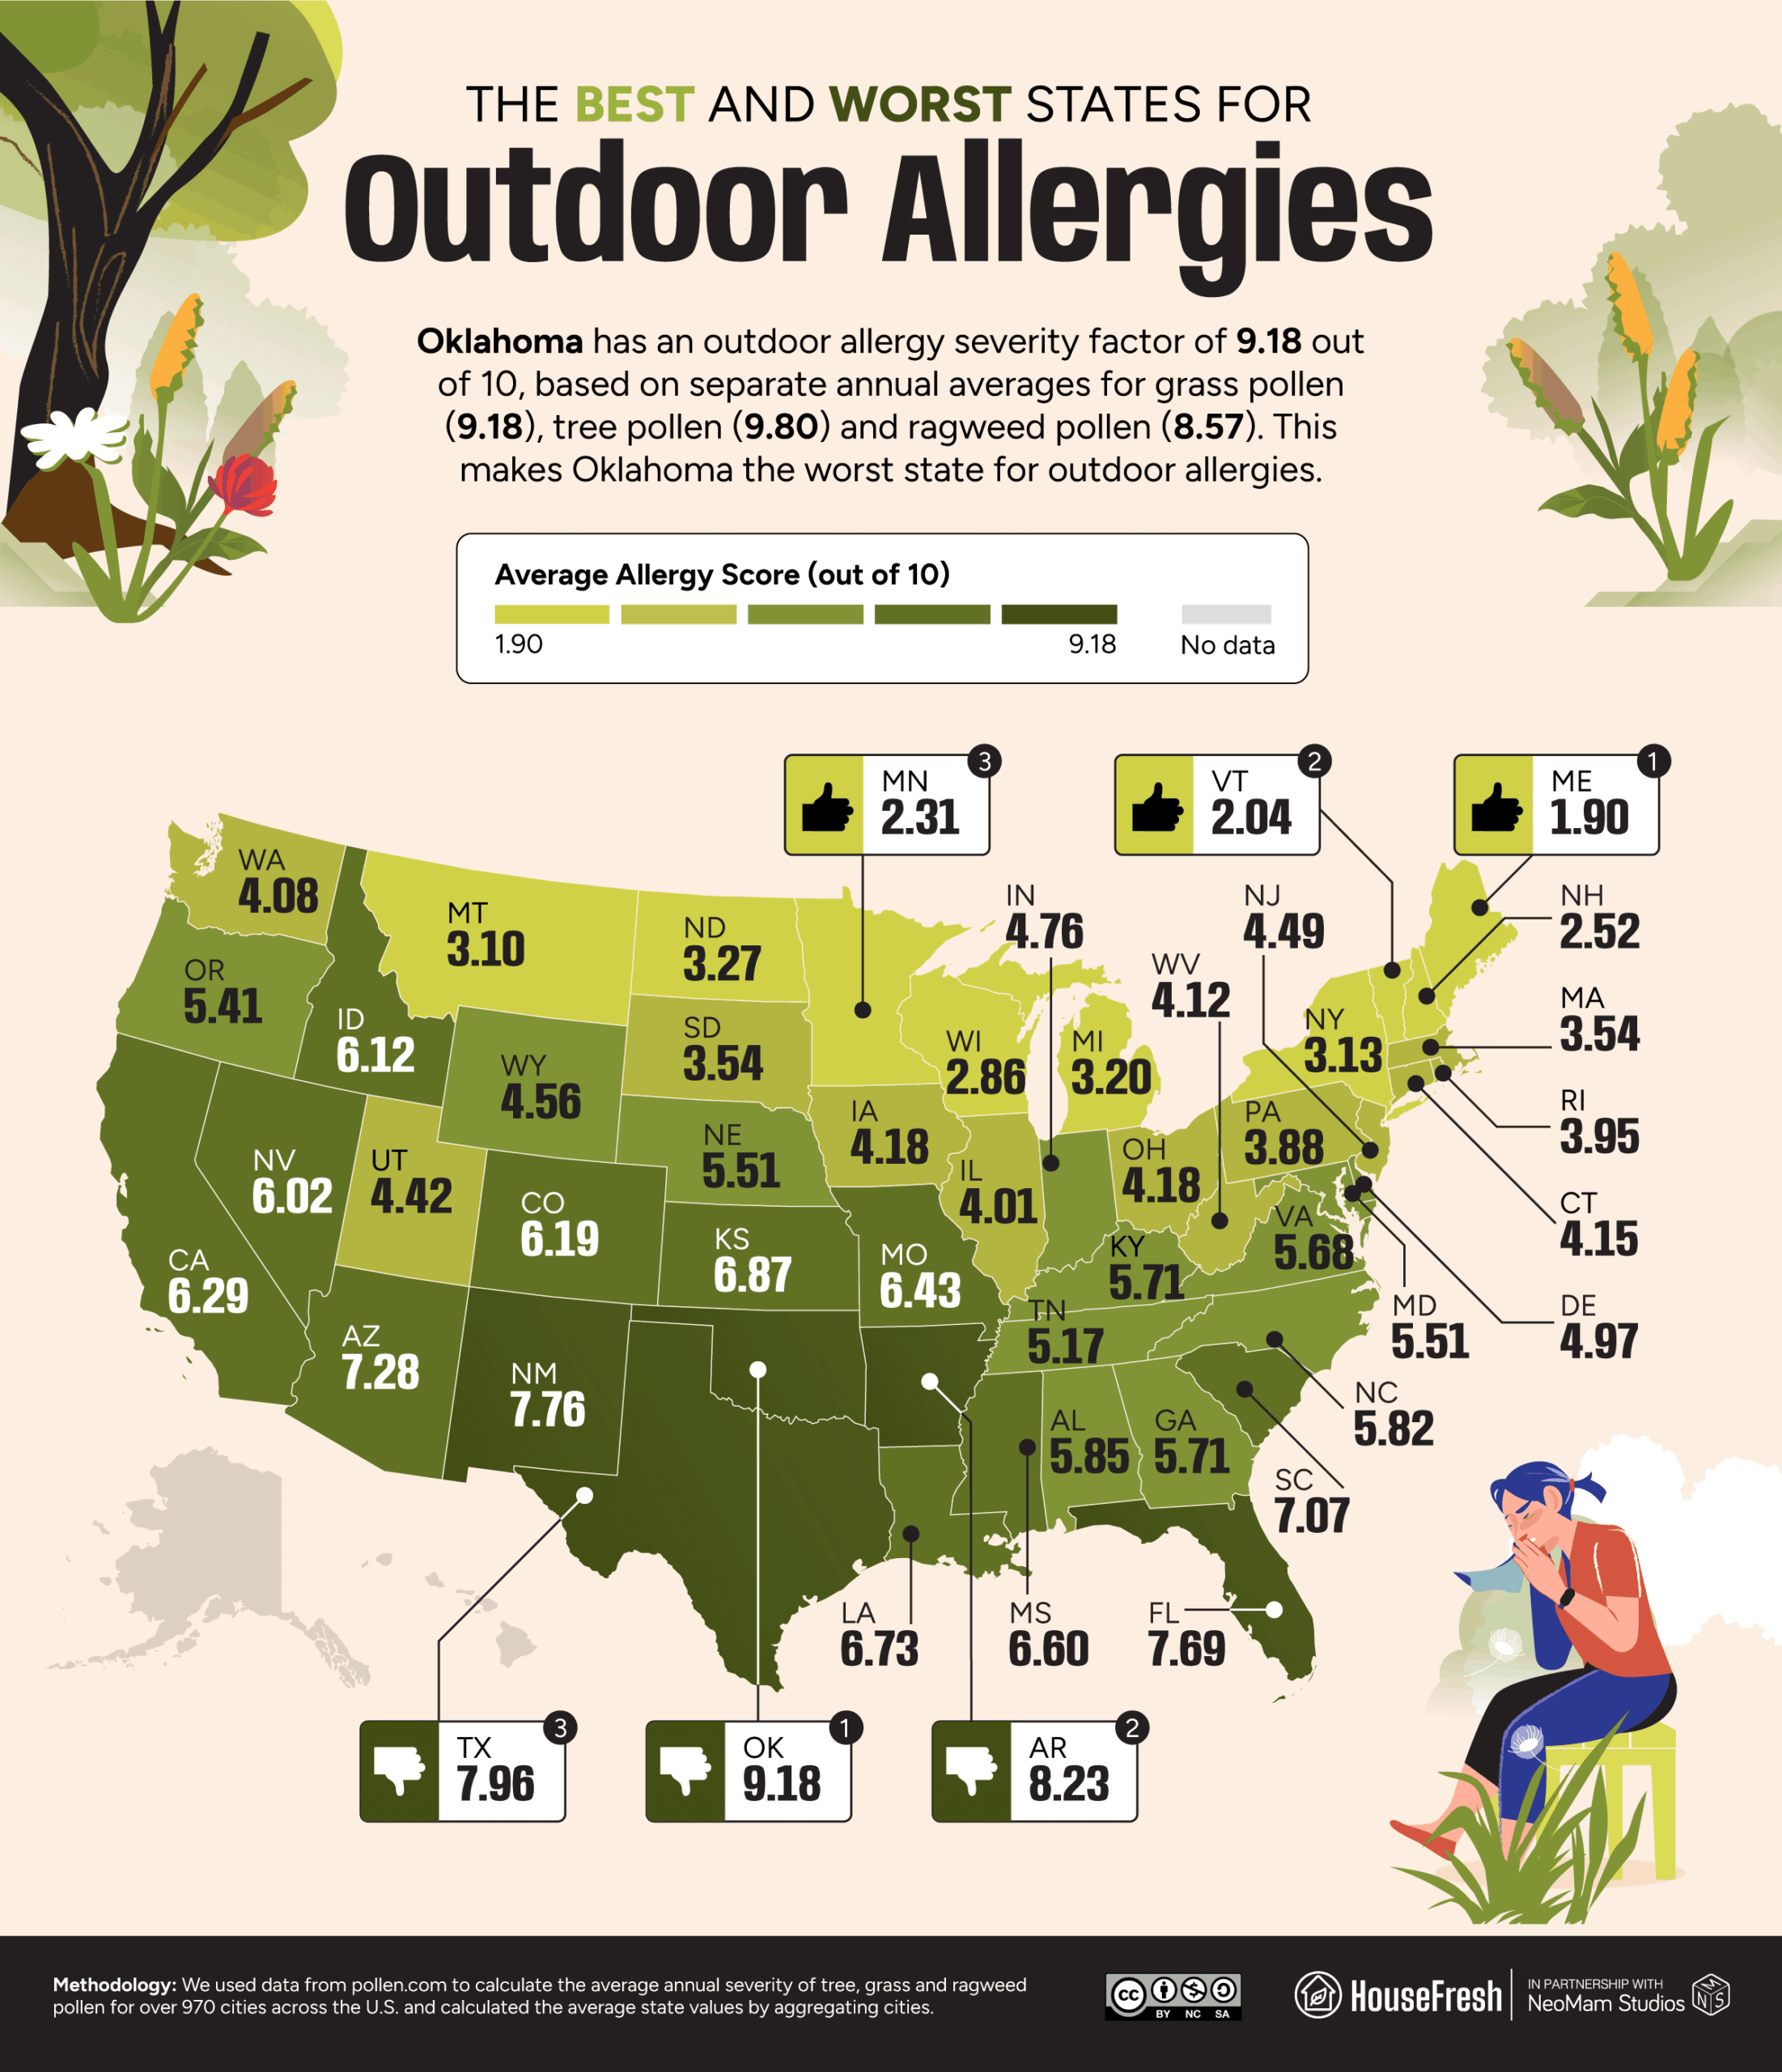
Oklahoma has the highest severity rating for outdoor allergies (9.18 out of 10) among all states.
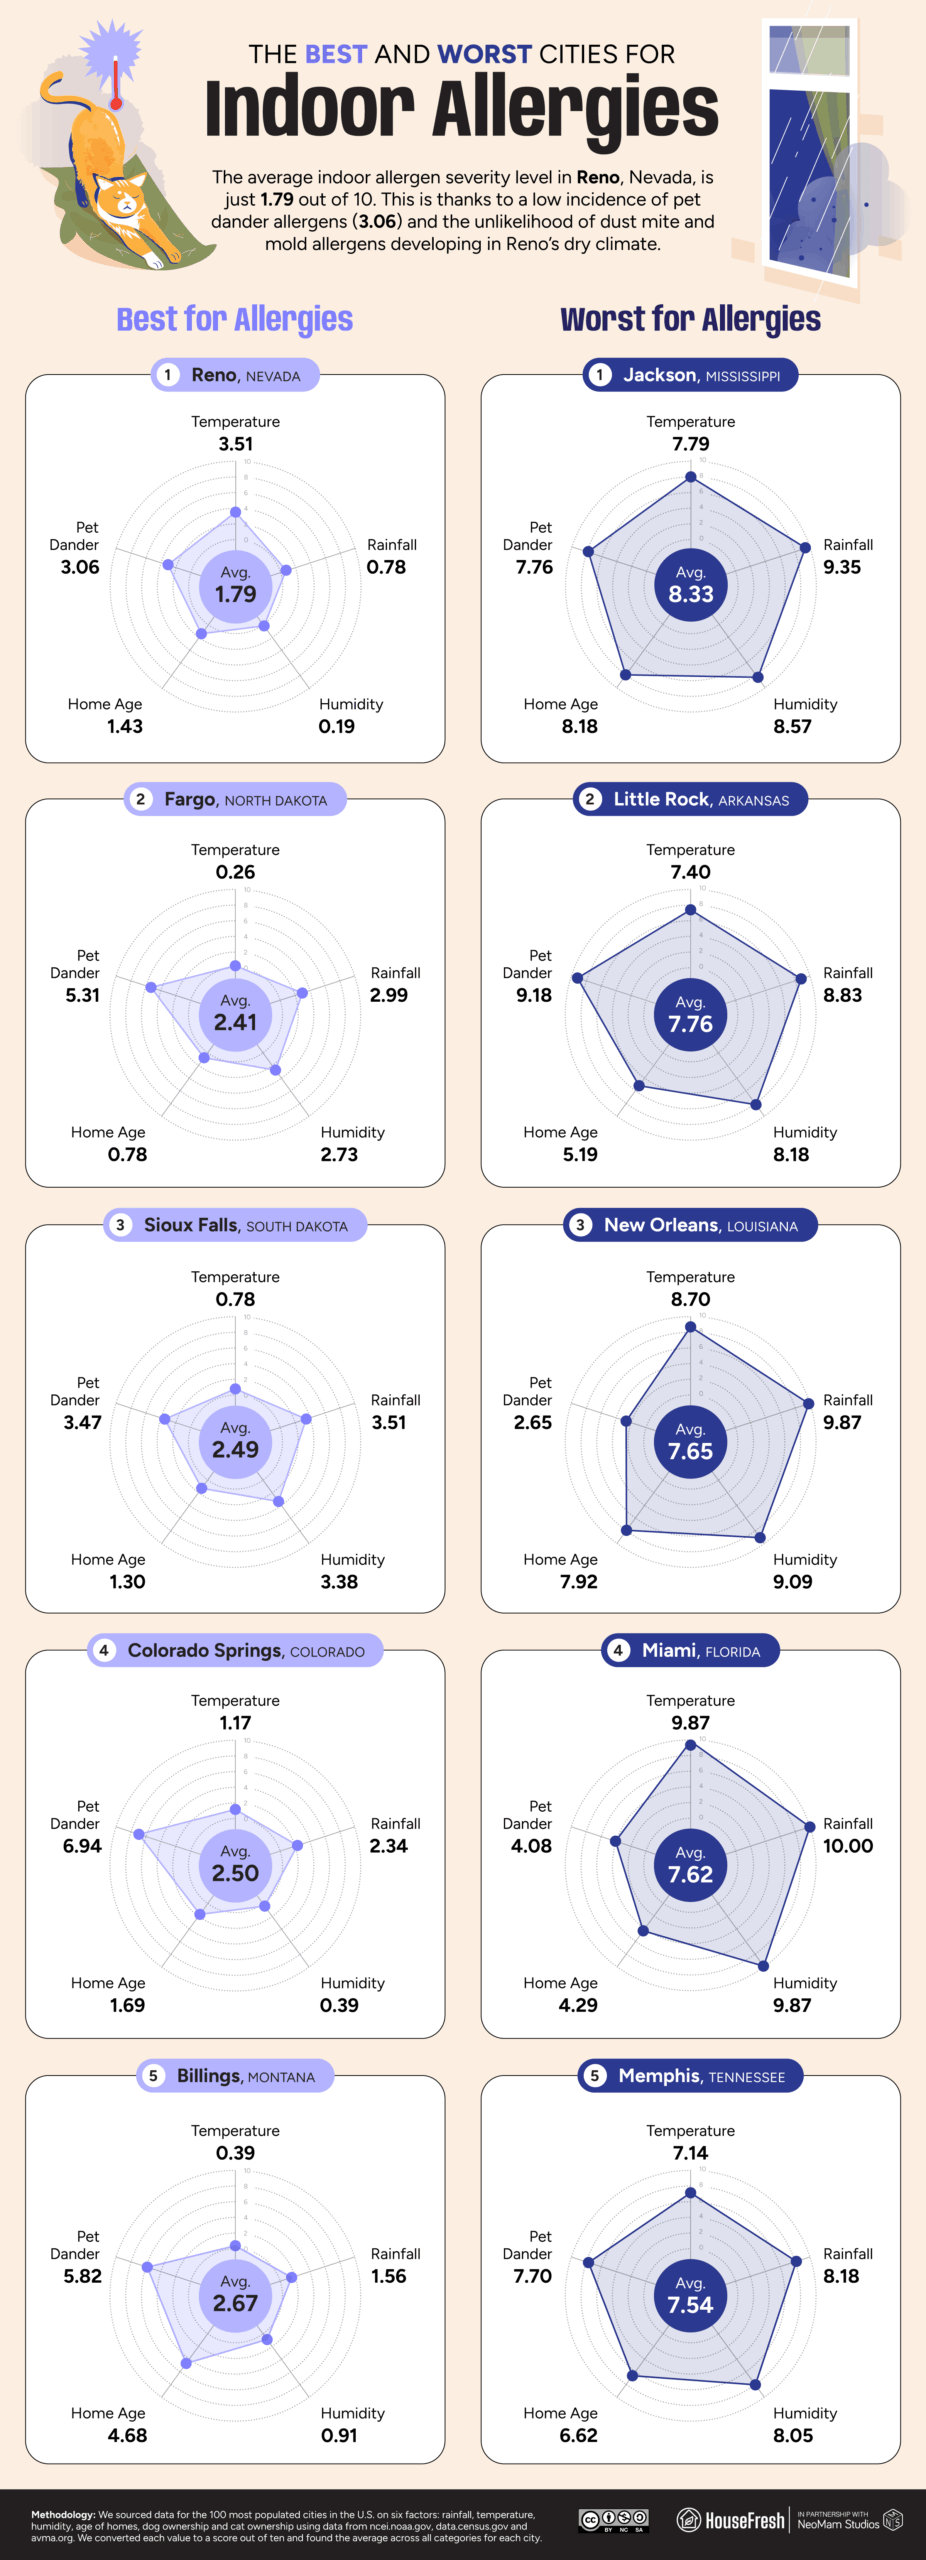
Reno (Nevada) is the greatest city for indoor allergens, with a severity rating of only 1.79, substantially lower than other big cities.
Texas has severe outdoor allergy ratings (10/10) for both grass and tree pollen
Climate change is contributing to increased pollen levels in the atmosphere.
The Methodology Behind This Study
To identify the U.S. states and cities that are best and worst for people with allergies, HouseFresh analyzed a series of metrics for outdoor and indoor allergens, respectively.
For the outdoor rankings, they sourced data for three allergens (tree, grass, ragweed) from the pollen.com website. The team calculated the average annual severity of these allergens for over 970 cities across the U.S. and calculated the average values by state by aggregating cities.
For the indoor rankings, they considered six factors for all states and the top 100 most populated cities in the U.S.:
Average annual rainfall (ncei.noaa.gov/)
Average annual temperature (ncei.noaa.gov/)
% of humid days (housefresh.com/the-most-humid-cities-in-the-world/)
Median age of homes (data.census.gov)
% of households with dogs (avma.org)
% of households with cats (avma.org)
Dust mites and mold allergens thrive in warm, wet, humid climates. Hence, rainfall, temperature, and humidity were considered as key factors that can promote mold and dust mite growth without intervention. Similarly, older homes are typically worse for mold owing to poor ventilation and insulation.
Dog and cat ownership rates were considered as indicators for the prevalence of another key indoor allergen: pet dander.
The final outdoor/indoor index scores were created by assigning values for each factor based on percentiles, assigning 10 to the highest value (worst score, relative to U.S. allergen levels). The further down the factor is located in the percentile distribution, the closer its assigned value is to 0 (best score). Then, to obtain an overall score, HouseFresh calculated the average score across all factors for each ranking (i.e., the average score across all indoor allergen factors).
The data is correct as of June 2025.
Southern states and cities have the most severe outdoor allergies
Oklahoma has the highest average severity (9.18), with grass pollen levels at 9.18, tree pollen at 9.80, and ragweed pollen at 8.57. However, people are sensitive to various forms of pollen, and it’s worth noting that Texas has higher levels of grass and tree pollen (both with a severity rating of 10, the worst in the United States). Only Texas’s low ragweed pollen count (3.88) lowers its overall severity rating compared to Oklahoma and Arkansas.
Why the South? Rising levels of carbon dioxide cause plants to produce pollen while warming the climate. Pollen seasons begin earlier, last longer, and are more intense as the climate warms. So-called “seasonal” allergies now last the entire calendar year in some areas, particularly in the Southern “pollen belt,” where it was warmer to start with and where strong winds circulate more pollen in the air and for longer.
Ragweed thrives on human-developed terrain, which may explain why ragweed pollen levels are around twice the average Texas level in these cities. According to one study, ragweed pollen levels could be seven times greater in a city that is 3.6 degrees warmer and emits 30% more carbon dioxide than neighboring rural areas, a common occurrence due to the urban heat island effect.
Hawaii and Mississippi have the most severe indoor allergies
Indoor allergens include pet dander, dust, and mold. Pet dander is the dead skin cells shed by furred or feathered pets that are light enough to go airborne and cause irritation, so the HouseFresh team considered local pet ownership rates when determining our severity grade. They also included typical temperature, rainfall, humidity, and home age, as these are factors that can exacerbate the presence and impact of dust mites and mold spores.
With humid weather and higher-than-average pet ownership rates, Hawaii and Mississippi are the worst states for indoor allergies, with average severity ratings of 7.94 and 7.51 out of ten, respectively.
The Hawaiʻi State Department of Health reports that dust mites and mold can cause severe asthma attacks, and 104,400 (9%) local adults and 30,000 (10%) children suffer from asthma in Hawaii. Asthma affects 15% of all Native Hawaiian adults.
Along with Mississippi, the steamy southern states of Arkansas, Louisiana, and Alabama rank among the top five worst places for indoor allergies. Temperatures in Arizona and California may be high, but the southwest is enduring a 25-year megadrought, with soil drier than it has been in 1,200 years. Although this ongoing calamity may lessen the risk of some indoor allergens, the drought pollutes the air by increasing the frequency and intensity of wildfires.
Jackson (Mississippi) has the most severe indoor allergies, with an average severity of 8.33 out of 10 based on high scores across all categories. While New Orleans is hotter, rainier, and more humid, the average overall severity score remains at 7.65, largely due to its comparatively low pet ownership rate.
Reno, Nevada, is the best city for indoor allergies, with a severity rating of jonly 1.79 out of 10, substantially lower than any other big metropolis. That may be a good reason to stay indoors, as Reno’s outdoor allergens are far more prevalent, and Reno has the fastest-expanding allergy season of any major city.
City
State
Temp. Score
Rainfall Score
Humidity Score
Home Age Score
Pet Dander Score
Average Allergy Score
Jackson
Mississippi
7.79
9.35
8.57
8.18
7.76
8.33
Little Rock
Arkansas
7.4
8.83
8.18
5.19
9.18
7.76
New Orleans
Louisiana
8.7
9.87
9.09
7.92
2.65
7.65
Miami
Florida
9.87
10
9.87
4.29
4.08
7.62
Memphis
Tennessee
7.14
8.18
8.05
6.62
7.7
7.54
Tampa
Florida
9.61
9.48
9.74
3.38
4.08
7.26
Honolulu
Hawaii
10
1.43
10
7.01
7.09
7.11
Tulsa
Oklahoma
6.36
6.62
7.4
6.75
7.14
6.86
Houston
Texas
9.22
7.92
9.35
3.12
4.08
6.74
Dallas
Texas
8.31
8.05
8.44
4.03
4.08
6.58
Jacksonville
Florida
8.44
9.61
9.22
1.56
4.08
6.58
Louisville
Kentucky
5.58
6.23
6.75
6.23
7.86
6.53
Charleston
South Carolina
8.05
8.44
8.83
1.04
5.66
6.41
Philadelphia
Pennsylvania
4.29
7.01
5.84
9.35
5.31
6.36
Norfolk
Virginia
5.71
8.7
7.53
6.88
2.65
6.3
Richmond
Virginia
5.45
8.31
6.62
7.79
2.65
6.17
Orlando
Florida
9.35
7.27
9.48
0.65
4.08
6.17
Huntsville
Alabama
7.01
7.66
7.79
2.08
6.02
6.11
Corpus Christi
Texas
9.48
3.38
9.61
3.9
4.08
6.09
Indianapolis
Indiana
3.64
5.71
5.71
5.71
9.18
5.99
Nashville
Tennessee
6.1
6.88
7.01
1.82
7.7
5.9
Greensboro
North Carolina
5.19
8.57
6.88
3.25
5.05
5.79
Bridgeport
Connecticut
3.12
8.96
4.94
9.09
2.76
5.77
Atlanta
Georgia
7.27
9.09
7.92
2.21
2.35
5.77
Lexington
Kentucky
4.68
7.14
6.1
2.99
7.86
5.75
Kansas City
Missouri
4.03
5.06
6.36
6.49
6.53
5.7
New York
New York
4.16
9.22
5.06
8.7
1.22
5.67
Oklahoma City
Oklahoma
5.84
4.55
7.14
3.64
7.14
5.66
Wichita
Kansas
4.94
3.77
6.23
5.58
7.5
5.6
Cleveland
Ohio
2.6
5.19
4.68
9.74
5.61
5.56
Toledo
Ohio
2.73
5.45
4.29
9.61
5.61
5.54
San Antonio
Texas
8.96
3.12
8.96
2.34
4.08
5.49
Raleigh
North Carolina
6.75
7.79
7.66
0.13
5.05
5.48
Pittsburgh
Pennsylvania
2.21
6.1
4.42
9.22
5.31
5.45
Baltimore
Maryland
4.55
6.75
5.97
8.83
1.02
5.42
Charlotte
North Carolina
6.49
7.4
7.27
0.39
5.05
5.32
Fort Wayne
Indiana
2.08
4.68
4.16
6.36
9.18
5.29
Detroit
Michigan
1.69
4.16
3.77
10
6.63
5.25
Austin
Texas
9.09
3.64
8.7
0.52
4.08
5.21
Omaha
Nebraska
2.47
3.9
5.45
5.97
7.81
5.12
Des Moines
Iowa
2.34
4.03
5.19
7.66
6.22
5.09
Milwaukee
Wisconsin
1.56
5.84
3.25
9.48
5.26
5.08
Fort Worth
Texas
7.53
4.29
8.31
1.17
4.08
5.08
Providence
Rhode Island
1.43
9.74
3.9
8.96
0.41
4.89
Columbus
Ohio
3.38
5.32
5.32
4.55
5.61
4.84
Lincoln
Nebraska
2.99
3.25
5.58
4.16
7.81
4.76
Boston
Massachusett s
1.95
7.53
3.64
8.31
1.84
4.65
Tucson
Arizona
8.83
1.3
2.6
5.06
5.36
4.63
Portland
Oregon
3.77
5.97
1.69
6.1
5.26
4.56
Los Angeles
California
5.97
2.47
2.86
7.53
3.67
4.5
Chicago
Illinois
2.86
4.42
4.81
8.44
1.63
4.43
San Francisco
California
5.06
2.6
2.21
8.57
3.67
4.42
Buffalo
New York
1.3
5.58
3.12
9.87
1.22
4.22
San Diego
California
6.62
1.17
4.55
4.81
3.67
4.16
Lubbock
Texas
6.88
2.73
4.03
2.86
4.08
4.12
Madison
Wisconsin
0.65
6.36
3.51
4.42
5.26
4.04
Phoenix
Arizona
9.74
0.39
2.47
1.95
5.36
3.98
Minneapolis
Minnesota
0.91
4.94
2.99
7.4
3.52
3.95
Seattle
Washington
1.82
4.81
1.17
5.32
6.43
3.91
Sacramento
California
6.23
2.21
1.3
4.94
3.67
3.67
Fresno
California
7.66
0.91
1.95
3.51
3.67
3.54
Boise
Idaho
3.25
1.82
0.52
2.73
9.29
3.52
San Jose
California
5.32
1.04
1.56
5.84
3.67
3.49
Salt Lake City
Utah
3.9
1.95
1.04
7.27
3.27
3.48
Spokane
Washington
0.52
1.69
0.65
8.05
6.43
3.47
El Paso
Texas
8.18
0.26
2.34
2.47
4.08
3.47
Denver
Colorado
1.04
2.08
0.78
5.45
6.94
3.26
Bakersfield
California
7.92
0.65
1.82
0.91
3.67
2.99
Albuquerque
New Mexico
4.81
0.52
1.43
3.77
4.34
2.97
Las Vegas
Nevada
8.57
0.13
2.08
0.26
3.06
2.82
Billings
Montana
0.39
1.56
0.91
4.68
5.82
2.67
Colorado Springs
Colorado
1.17
2.34
0.39
1.69
6.94
2.5
Sioux Falls
South Dakota
0.78
3.51
3.38
1.3
3.47
2.49
Fargo
North Dakota
0.26
2.99
2.73
0.78
5.31
2.41
Reno
Nevada
3.51
0.78
0.19
1.43
3.06
1.79
Scores in the table are shown out of ten.
Tips
To determine which kind of pollen you are allergic to, take a doctor’s test or complete this Kleenex quiz.
Consider getting an air purifier with , allowing you to run it inside your home 24/7.
When high pollen counts are expected, close doors and windows, and avoid hanging clothing outside to prevent pollen from entering the home.
Avoid going outside while someone is mowing the grass or cutting hedges and trees.
Avoid using a dry cloth or a feather duster; instead, use a microfiber cloth or a damp rag to trap most dust without recirculating it. Use a HEPA-filtered vacuum cleaner to clean carpets, upholstered furniture, and drapes on a regular basis.
To eradicate dust mites, hot wash your bedding once a week and then tumble dryer for 10 minutes on high heat.
To eradicate dust mites, hot wash your bedding once a week and then tumble dry it for 10 minutes on high heat.
Brush your pet’s fur on a regular basis to lessen the amount of dander that is emitted into the air. Try to create pet-free zones in your home (even if it’s just your bedroom!) to decrease your interaction with dander.
To limit your mold exposure, keep your home dry by repairing leaks, venting your clothes dryer outside, and installing insulation and storm windows.


 rated fast-food chains across the United States")
")

