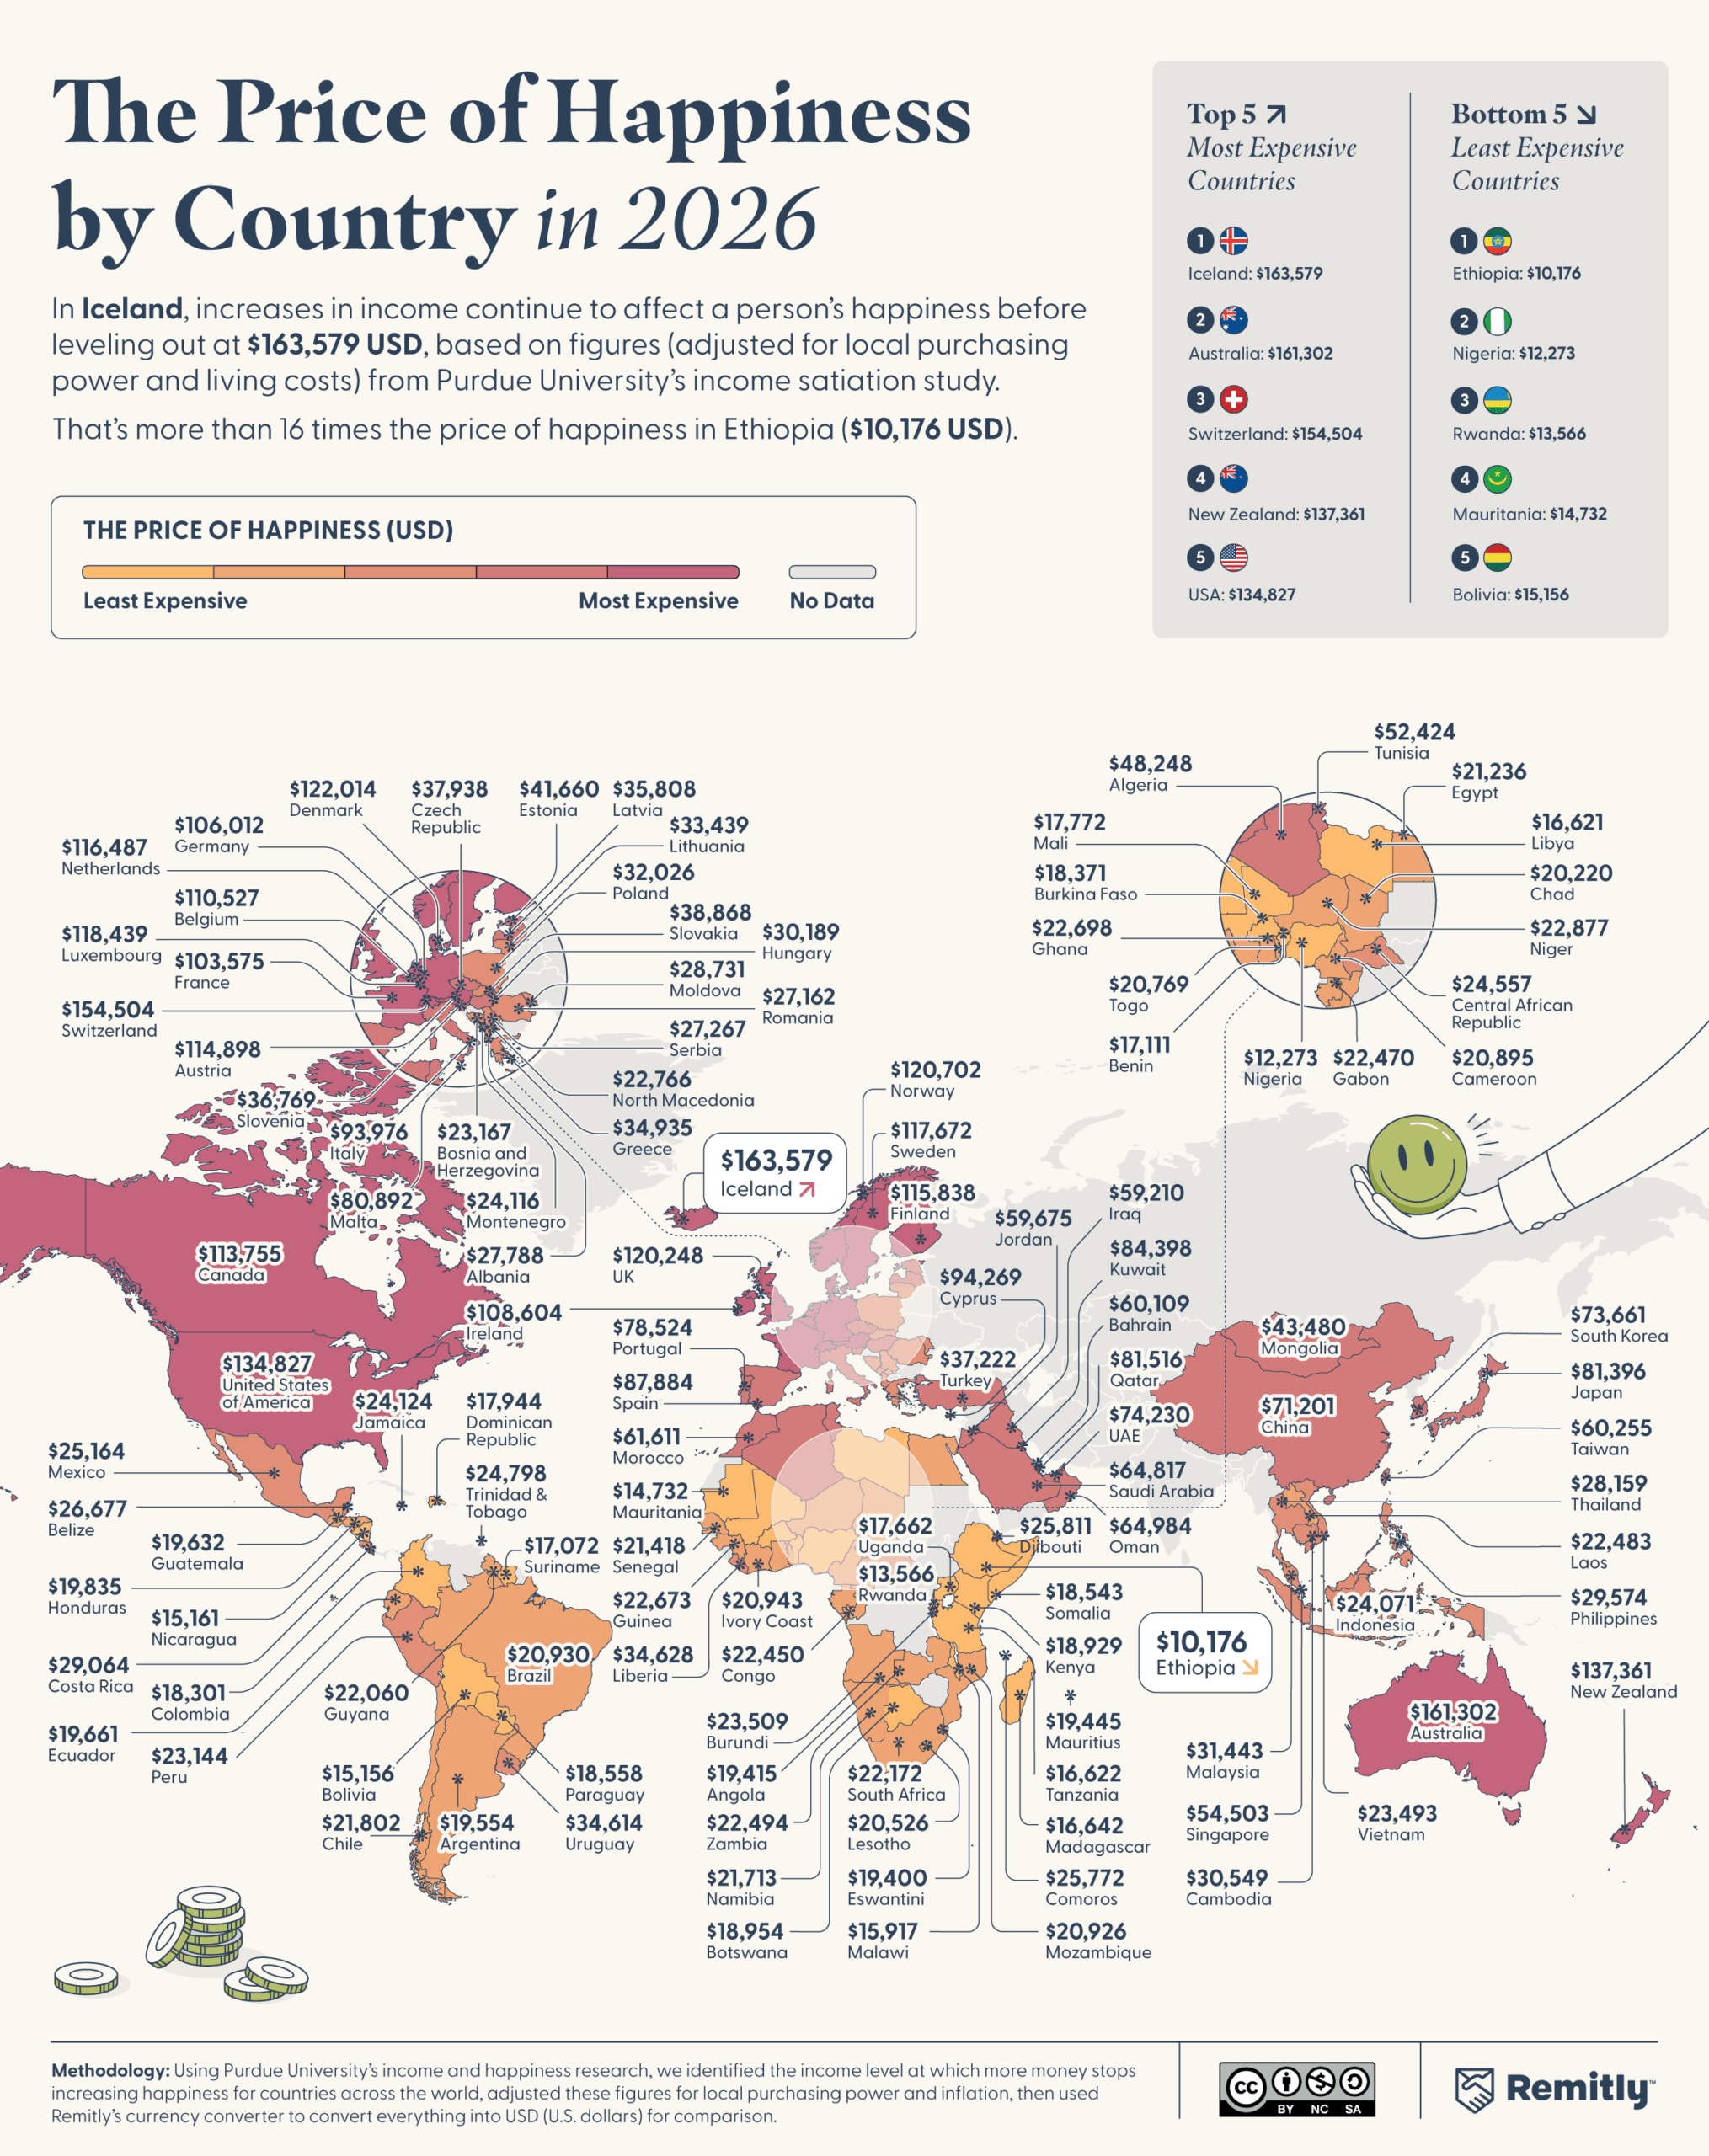
Money and happiness have a complicated relationship. Up to a point, more income genuinely does improve how people feel about their lives. Past that point, it stops mattering, at least to the part of your brain that’s keeping score on whether life is going well.
A Purdue University study published in Nature Human Behaviour in 2018 put numbers to this using data from over 1.7 million people across 164 countries. The researchers called the cutoff “income satiation,” the salary level beyond which further increases show no measurable improvement in how people evaluate their own lives. Remitly used those figures, adjusting for local purchasing power and inflation in each country, to calculate the “price of happiness”: that threshold mapped across 123 countries.
Wealthier countries need higher incomes to reach satiation. According to the world map above, Northern and Western Europe dominate the expensive end. Much of sub-Saharan Africa and Latin America are at the other extreme.
$163,579 per year is Iceland’s price of happiness, the highest of any country in the study. That number matches Iceland’s second-place finish in the 2025 World Happiness Report, and the two facts reinforce each other. Iceland’s rising happiness is closely tied to its world-leading social support scores. The author Hrund Gunnsteinsdóttir told the BBC that genuine gender equality tends to bring social and economic stability with it, which in turn drives wellbeing. Iceland seems to bear that out.
Ethiopia is at the other end at $10,176 per year, against an average annual income of around $777. The income level where life satisfaction would stop rising is more than 13 times what most Ethiopians earn. A lot of the countries near the bottom of this list face a similar problem, with average wages covering less than 40% of even a relatively modest satiation threshold.
Eighteen countries reach six figures in U.S. dollars. Fourteen of them are in Europe, with the U.S., Canada, Australia, and New Zealand making up the rest.
The One Country That Actually Covers the Bill
Almost everywhere in the world, average wages fall short of the income satiation point. Often well short.
Slovenia is the one exception. The typical income there is $42,754, which clears the satiation threshold of $36,769 by 16.3%. No other country in the study achieves that. Part of what may explain it: Slovenia is one of a small group of countries, along with Latvia and Poland, that formally use wellbeing and happiness metrics as inputs to government policy decisions rather than treating them as background data. Latvia’s average wage covers 84.7% of its price of happiness; Poland’s covers 74.5%. Both rank among the 11 countries globally where that ratio is highest.
#
Country
Avg. Wage (USD)
Price of Happiness (USD)
Wage as % of Threshold
1
Slovenia
$42,754
$36,769
116.3%
2
Luxembourg
$109,919
$118,439
92.8%
3
Estonia
$37,710
$41,660
90.5%
4
Singapore
$49,048
$54,503
90.0%
5
Lithuania
$29,814
$33,439
89.2%
6
Czech Republic
$33,304
$37,938
87.8%
7
Latvia
$30,321
$35,808
84.7%
8
Greece
$27,859
$34,935
79.7%
9
Belgium
$87,478
$110,527
79.1%
10
Romania
$20,716
$27,162
76.3%
11
Poland
$23,864
$32,026
74.5%
12
Denmark
$81,489
$122,014
66.8%
13
Malta
$53,565
$80,892
66.2%
14
Netherlands
$75,450
$116,487
64.8%
15
Norway
$77,437
$120,702
64.2%
16
Germany
$66,876
$106,012
63.1%
17
Ireland
$66,680
$108,604
61.4%
18
Chile
$13,271
$21,802
60.9%
19
Austria
$69,673
$114,898
60.6%
20
Finland
$68,548
$115,838
59.2%
21
Montenegro
$14,088
$24,116
58.4%
22
France
$59,417
$103,575
57.4%
23
Switzerland
$87,180
$154,504
56.4%
24
Serbia
$15,338
$27,267
56.2%
25
United States
$75,275
$134,827
55.8%
26
Costa Rica
$15,716
$29,064
54.1%
27
Bosnia and Herzegovina
$12,272
$23,167
53.0%
28
Hungary
$15,780
$30,189
52.3%
29
Qatar
$41,721
$81,516
51.2%
30
Italy
$46,266
$93,976
49.2%
31
Slovakia
$19,025
$38,868
48.9%
32
Spain
$42,528
$87,884
48.4%
33
South Korea
$35,377
$73,661
48.0%
34
Sweden
$55,726
$117,672
47.4%
35
Canada
$50,468
$113,755
44.4%
36
Uruguay
$15,183
$34,614
43.9%
37
Mauritius
$8,398
$19,445
43.2%
38
Cyprus
$37,114
$94,269
39.4%
39
Australia
$59,030
$161,302
36.6%
40
Brazil
$7,612
$20,930
36.4%
41
Bolivia
$5,475
$15,156
36.1%
42
Argentina
$7,050
$19,554
36.1%
43
United Kingdom
$43,128
$120,248
35.9%
44
Saudi Arabia
$23,012
$64,817
35.5%
45
Albania
$9,670
$27,788
34.8%
46
Colombia
$6,351
$18,301
34.7%
47
Dominican Republic
$6,108
$17,944
34.0%
48
New Zealand
$46,689
$137,361
34.0%
49
Paraguay
$6,250
$18,558
33.7%
50
Ecuador
$6,461
$19,661
32.9%
How the U.S. Numbers Break Down by City
The national figure of $134,827 is the fifth-highest in the world, but averages smooth over enormous local variation. Remitly calculated the satiation point for 50 major cities using Numbeo’s cost-of-living index.
New York tops the list at $195,969 per year. Rent there runs about 149% of the national average. The Center for New York City Affairs has also documented that the city’s wage gap between top and bottom earners keeps widening, even as it shrinks in most other U.S. cities. Honolulu and San Francisco are right behind at $192,441 and $191,266 respectively.
The cheapest city in the dataset is Cincinnati, Ohio, at $122,480, roughly $73,000 below New York. Houston ($125,224), San Antonio ($123,656), and Austin ($130,123) are close to the bottom as well, which makes sense given Texas’s lower overall cost structure compared to the coasts.
Rank
City
Price of Happiness (USD)
1
New York, NY
$195,969
2
Honolulu, HI
$192,441
3
San Francisco, CA
$191,266
4
Seattle, WA
$176,960
5
Washington, DC
$171,081
6
San Jose, CA
$169,317
7
Boston, MA
$168,925
8
Oakland, CA
$166,965
9
Berkeley, CA
$163,634
10
San Diego, CA
$160,694
11
Anchorage, AK
$159,715
11
Los Angeles, CA
$159,715
13
Miami, FL
$155,795
14
Sacramento, CA
$155,207
15
Philadelphia, PA
$154,423
16
New Orleans, LA
$151,092
17
Jersey City, NJ
$149,328
18
Chicago, IL
$148,936
19
Atlanta, GA
$147,565
20
Portland, OR
$147,369
21
Denver, CO
$147,173
22
Dallas, TX
$142,861
23
Baltimore, MD
$140,706
24
Phoenix, AZ
$140,314
25
Buffalo, NY
$140,118
25
Minneapolis, MN
$140,118
27
Nashville, TN
$137,766
28
Pittsburgh, PA
$137,570
29
Tampa, FL
$137,178
30
Charlotte, NC
$136,786
31
Columbus, OH
$136,002
32
Richmond, VA
$135,218
32
Orlando, FL
$135,218
32
Indianapolis, IN
$135,218
32
Madison, WI
$135,218
36
Raleigh, NC
$132,867
37
Oklahoma City, OK
$132,279
38
Fort Worth, TX
$131,103
39
Salt Lake City, UT
$130,711
39
Boise, ID
$130,711
41
Austin, TX
$130,123
42
Milwaukee, WI
$128,751
43
Cleveland, OH
$127,772
44
Knoxville, TN
$127,184
45
Jacksonville, FL
$126,400
46
Tucson, AZ
$125,420
47
Houston, TX
$125,224
48
Albuquerque, NM
$123,852
49
San Antonio, TX
$123,656
50
Cincinnati, OH
$122,480
City-Level Data for the UK, Australia, Canada, and Spain
Remitly ran the city-level calculation for four other countries too.
London’s price of happiness is £116,097 GBP ($155,187 USD), 14.8% above second-placed Oxford. Every one of the five most expensive UK cities is in the South or Southeast of England, which isn’t surprising given how income and cost of living are distributed across the country. Sheffield has the lowest figure among the 23 UK cities at £83,723 GBP ($111,912 USD). The 2026 Happy City Index put London at 48th globally for happiness. For a city of its wealth and cultural weight, that’s a sobering number, and the Trust for London’s research goes some way to explaining it: four million Londoners live in households without enough for a basic standard of living, half of them children.
Rank
City
Price of Happiness (USD)
Price of Happiness (GBP)
1
London
$155,187
£116,097
2
Oxford
$135,146
£101,104
3
Guildford
$133,727
£100,043
4
Brighton
$132,131
£98,849
5
Cambridge
$131,067
£98,052
6
Edinburgh
$129,470
£96,858
7
Reading
$126,455
£94,603
8
Bristol
$126,101
£94,337
9
Southampton
$124,859
£93,409
10
Manchester
$124,150
£92,878
11
Birmingham
$121,667
£91,020
12
Leeds
$121,312
£90,755
13
Glasgow
$120,248
£89,959
14
Newcastle
$120,071
£89,826
15
Milton Keynes
$119,361
£89,295
16
York
$119,184
£89,163
17
Bournemouth
$118,829
£88,897
17
Cardiff
$118,829
£88,897
19
Liverpool
$117,233
£87,703
20
Belfast
$116,878
£87,438
21
Nottingham
$115,991
£86,774
22
Coventry
$114,927
£85,978
23
Sheffield
$111,912
£83,723
Australia’s seven cities are led by Sydney at $178,407 USD ($255,524 AUD). Brisbane is the lowest of the group at $153,938 USD ($220,478 AUD), which is somewhat counterintuitive. The city has been absorbing large numbers of people relocating from other Australian states, and housing prices have risen sharply as a result. SGS Economics and Planning rated Brisbane highly for overall wellbeing despite the housing pressure, though the satiation figure may not yet fully reflect what it costs to live there now.
Rank
City
Price of Happiness (USD)
Price of Happiness (AUD)
1
Sydney
$178,407
$255,524
2
Canberra
$169,142
$242,254
3
Melbourne
$168,192
$240,893
4
Gold Coast
$167,241
$239,532
5
Adelaide
$162,015
$232,047
6
Perth
$161,540
$231,366
7
Brisbane
$153,938
$220,478
In Canada, Victoria comes out on top at $124,047 USD ($169,951 CAD). Vancouver and Toronto are essentially tied for second at $121,881 USD ($166,982 CAD) each. The living wage in Victoria has been climbing steadily in step with costs. Kingston, Ontario, has the lowest price of happiness in the country at $102,560 USD ($140,513 CAD), which is a little surprising: Kingston has become one of Canada’s priciest rental markets, and the purchasing-power methodology used here may not yet capture how much that’s changed day-to-day costs.
Rank
City
Price of Happiness (USD)
Price of Happiness (CAD)
1
Victoria
$124,047
$169,951
2
Vancouver
$121,881
$166,982
2
Toronto
$121,881
$166,982
4
Saskatoon
$116,644
$159,808
4
Calgary
$116,464
$159,561
6
Kitchener
$116,102
$159,066
7
Guelph
$115,200
$157,829
8
Halifax
$114,297
$156,592
9
Kelowna
$113,936
$156,098
10
Regina
$113,755
$155,850
11
Mississauga
$112,672
$154,366
12
Edmonton
$112,130
$153,624
13
Ottawa
$111,408
$152,634
14
Quebec City
$109,422
$149,913
15
Montreal
$108,158
$148,181
16
London, ON
$107,977
$147,934
16
Winnipeg
$107,977
$147,934
18
Hamilton
$106,352
$145,708
19
Kingston
$102,560
$140,513
Spain’s 12 cities are much closer together than those in any other country in the study. Madrid leads at $102,190 USD (€89,759), and even last-placed Granada is only 18.5% below that at $83,285 USD (€73,153). To put that in perspective, the U.S. range spans more than $73,000. Madrid, Barcelona ($100,828 USD / €88,562), and Palma de Mallorca ($100,487 USD / €88,263) happen to be among Spain’s priciest cities for rent as well. Barcelona was the only one of the three to appear in a data-driven ranking of Spain’s ten happiest cities, where good urban infrastructure and reliable sunshine gave it an edge. As for Granada, finishing last here says more about its cost of living than about quality of life. Its climate, architecture, and relatively reasonable housing make it genuinely livable in ways that don’t show up in a satiation threshold.
Rank
City
Price of Happiness (USD)
Price of Happiness (EUR)
1
Madrid
$102,190
€89,759
2
Barcelona
$100,828
€88,562
3
Palma de Mallorca
$100,487
€88,263
4
Bilbao
$92,993
€81,680
5
Oviedo
$91,290
€80,184
6
Malaga
$87,543
€76,893
7
Santa Cruz de Tenerife
$87,373
€76,744
8
Alicante
$86,691
€76,145
9
Valencia
$86,180
€75,696
10
Seville
$84,988
€74,649
11
Las Palmas de Gran Canaria
$83,966
€73,752
12
Granada
$83,285
€73,153
How Income Connects to Wellbeing
Personal happiness depends on a lot of things, but an income that provides a genuine sense of safety, freedom, and control over your own life is a baseline factor. The results from Finland’s Universal Basic Income trial support this: giving unemployed participants a modest monthly cash injection only slightly improved their chances of finding employment, but it significantly boosted multiple measures of their wellbeing and reinforced positive individual and societal feedback loops.
The Purdue study highlights several critical nuances. Education level also affects the price of happiness, though this analysis focused on location. Data show that higher education levels also increase the income required for happiness. Furthermore, the authors note the ‘hedonic treadmill’ effect, where individual happiness naturally adapts and returns to a baseline after major life changes. Lastly, the study’s peak happiness markers represent a cross-sectional comparison between distinct income groups, rather than tracking an individual’s personal emotional journey after receiving a salary increase.
In every country except Slovenia, average wages fall below the price of happiness. That points to real work still to be done in aligning the labor people do with the material rewards they get in return. Closing that gap would feed individual wellbeing and knock-on benefits for communities.


")

