Buying a home has never been cheap, but in some states, it’s become nearly impossible without a high salary. The maps below break down home affordability across the U.S., showing the income required to purchase an average home based on a 30-year mortgage with a 10% down payment.
How Much Do You Need to Afford a Home in Your State?
According to data from Zillow and Mortgage Calculator, the salary needed to buy an average home varies drastically depending on location. Some states remain relatively affordable, while others demand six-figure incomes just to own a modest house.
How Much Income You Need to Afford the Average Home in Every U.S. State” by HowMuch.net howmuch.net (2018)
The Most Affordable States (2018 Data)
If you’re looking for affordable housing, these states required the lowest salaries to purchase an average home based on 2018 data:
West Virginia – $38,320 for a $149,500 home
Ohio – $38,400 for a $149,900 home
Michigan – $40,800 for a $160,000 home
Arkansas – $41,040 for a $161,000 home
Missouri – $42,200 for a $165,900 home
The Least Affordable States (2018 Data)
On the other hand, these states demanded the highest salaries to afford an average home:
Hawaii – $153,520 for a $610,000 home
Washington, D.C. – $138,440 for a $549,000 home
California – $120,120 for a $499,900 home
Massachusetts – $101,320 for a $419,900 home
Colorado – $100,200 for a $415,000 home
California continued to have the biggest gap between median household income and the income required to afford a home.
The Gap Between Income and Housing Costs
In some areas, home prices have skyrocketed well beyond what the average household earns. The following map highlights the difference between median household income and the income needed to afford a home in each state based on 2018 data.
Gap Between Median Household Income and Income Needed To Afford Median-Priced Home in Each U.S. State” by HowMuch.net & Reddit user: Fye_Maximus (2018)
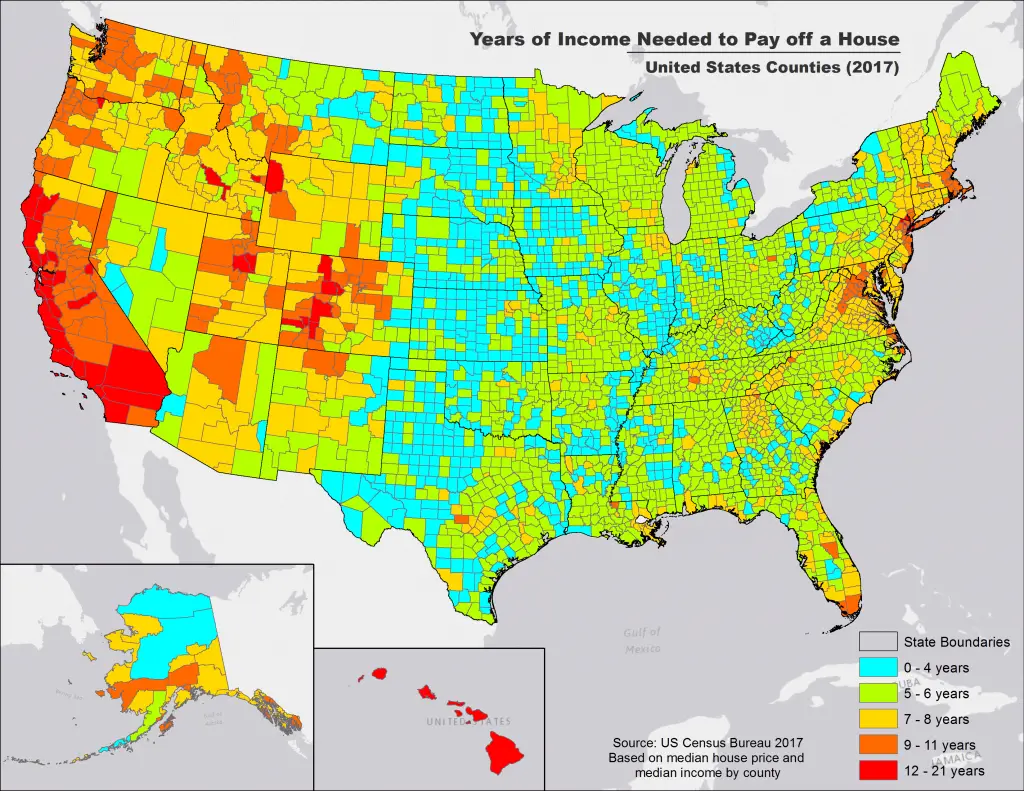
How Long Does It Take to Pay Off a Home?
Depending on where you live, buying a home can take anywhere from a few years to decades to pay off. In some counties, it took over 20 years of income to afford a house, while in others, just a couple of years was enough.
Years of Income Needed to Pay Off a House” by Reddit user: kc2184 (2018)
Least time required: King County, Texas – 1.3 years (Median income: $29,918, Median home price: $38,800)
Most time required: Kings County (Brooklyn), New York – 20.8 years (Median income: $29,928, Median home price: $623,900)
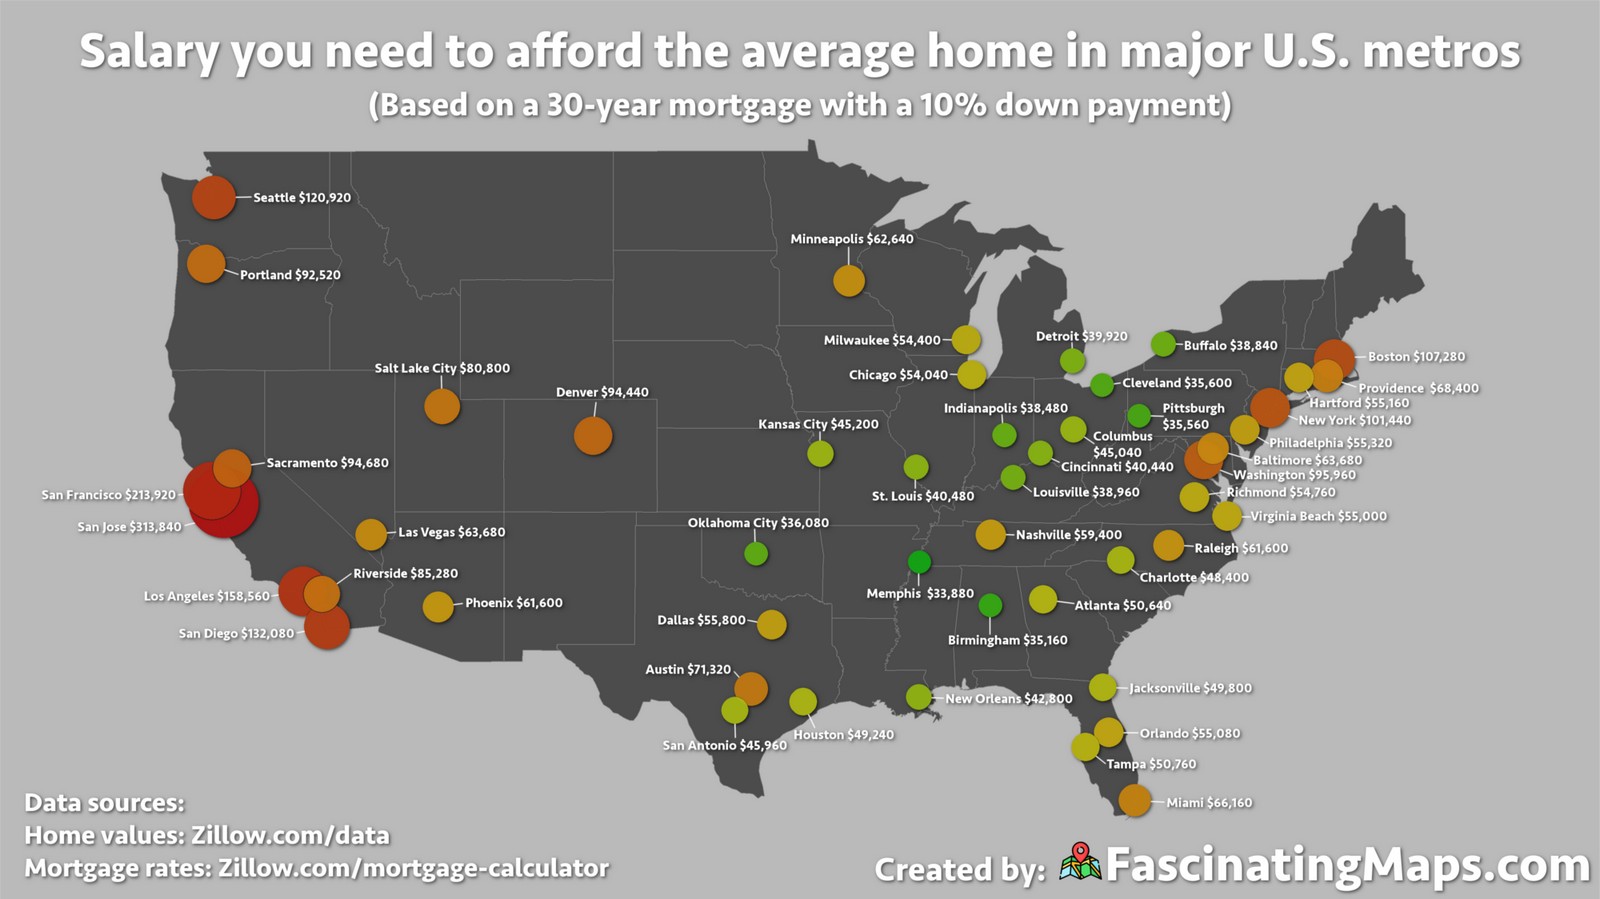
Home Affordability in Major U.S. Cities
Housing affordability also varied greatly in metro areas. Some cities were nearly impossible to buy into without a very high salary.
The Salary You Need to Afford the Median-Priced Home in Major U.S. Metros” by FascinatingMaps.com (2018)
San Jose, California, topped the list as the least affordable city, with real estate prices making homeownership a challenge for most residents.
Final Thoughts
With home prices continuing to rise, affordability remains a major concern in many parts of the country. Whether you’re planning to buy your first home or relocate, understanding salary requirements by state can help set realistic expectations.
What do you think about these numbers? Are home prices in your state reasonable, or do they seem out of reach? Drop a comment below and let us know your thoughts!
Seriously? Have you looked at home prices in Charlotte, NC recently? NO way the price for a home in Charlotte is easier to afford than for the state as a whole.
Alex E
7 years ago
I’m sorry. If you want to retire, and afford the listed houses, you need more money.
Alex E
7 years ago
Why would everyone need to buy the median priced home? If that happened it would cease to be the median price. That much is statistically certain. Similarly, not everyone who earns a paycheck is ready to buy a home. Most folks prefer to get their family and career underway first.
Alex E
7 years ago
I’m in awe!
Alex E
7 years ago
I’m curious to see how this would look if you broke out the top cities. Or did cities vs rural.
Alex E
7 years ago
So it appears to be liberal states where the gap is greatest … funny how that works.
Alex E
7 years ago
This is what happens when you allow banks to create magic money out of thin air to give to people who then bid up prices with it.


What if the minimum wage was based on “The 30% rule”?
Median percent of income spent on housing costs by U.S. county
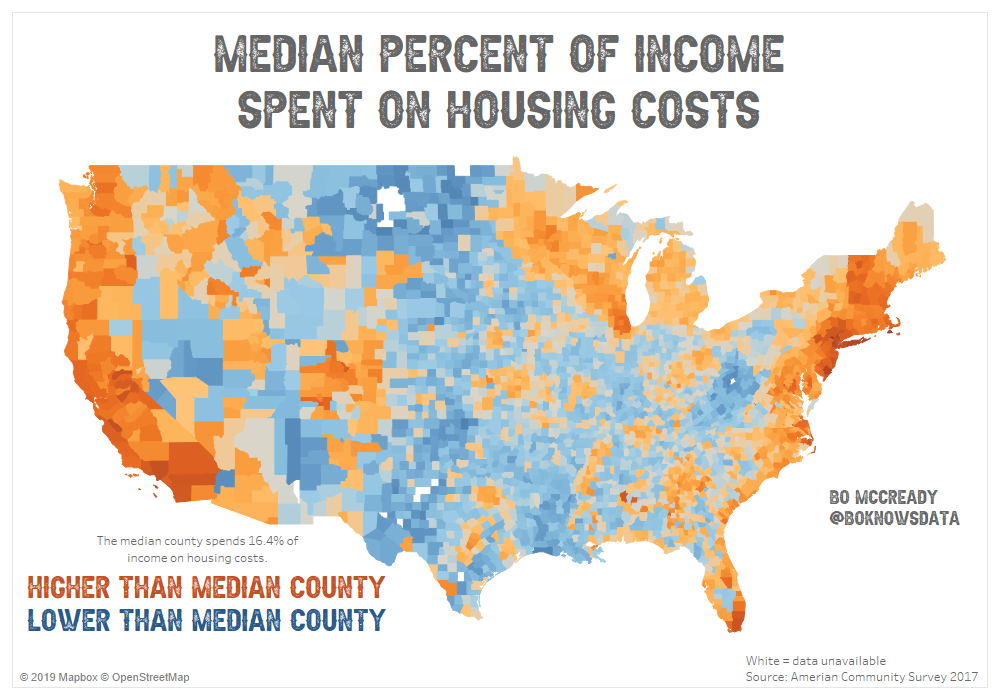
Reddit user: BoMcCready
This map is useless because property taxes are NOT included.
Large U.S. cities with the best rental housing accessibility rate
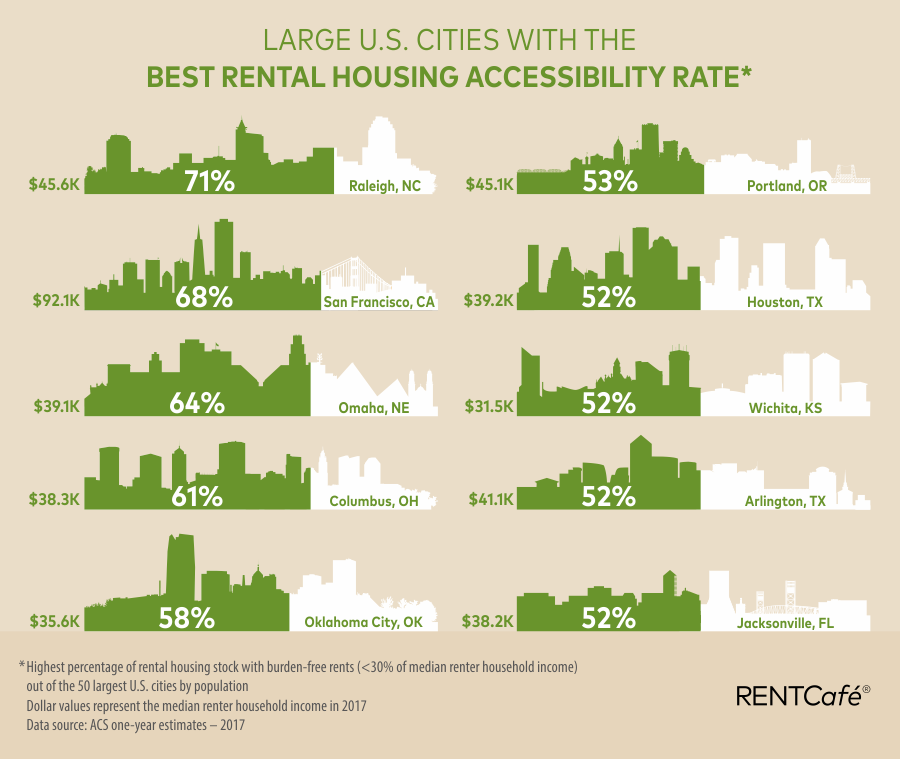
Large U.S. cities with the worst rental housing accessibility rate
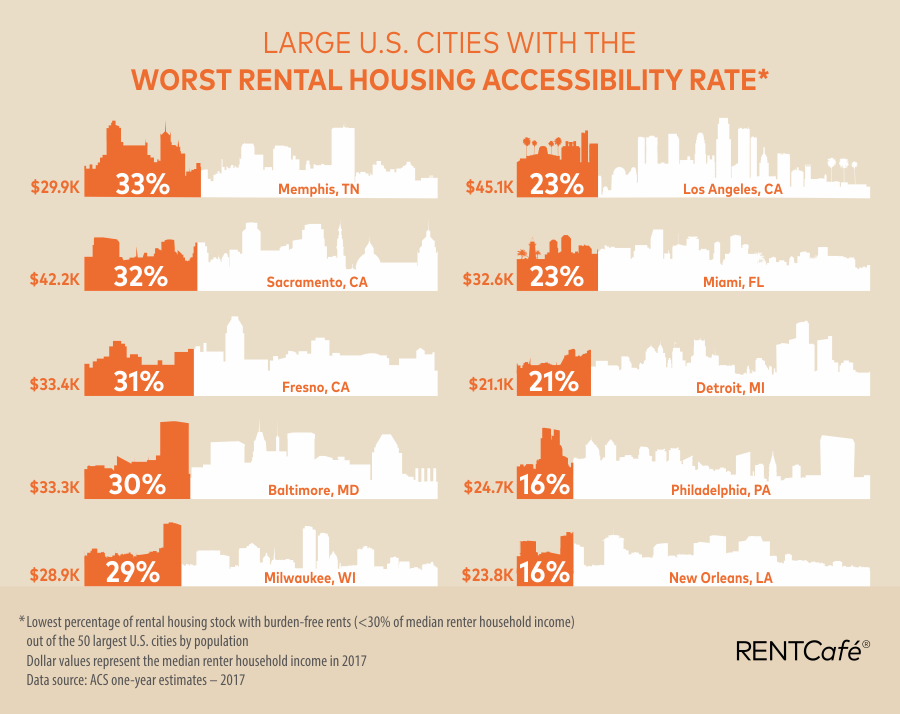
Source: https://www.rentcafe.com/blog/rental-market/renters-median-income-accessibility-of-rental-stock/
We are totally fine with you reposting our content, but you have to comply with our Copyright Statement. https://fascinatingmaps.com/copyright-information/
Seriously? Have you looked at home prices in Charlotte, NC recently? NO way the price for a home in Charlotte is easier to afford than for the state as a whole.
I’m sorry. If you want to retire, and afford the listed houses, you need more money.
Why would everyone need to buy the median priced home? If that happened it would cease to be the median price. That much is statistically certain. Similarly, not everyone who earns a paycheck is ready to buy a home. Most folks prefer to get their family and career underway first.
I’m in awe!
I’m curious to see how this would look if you broke out the top cities. Or did cities vs rural.
So it appears to be liberal states where the gap is greatest … funny how that works.
This is what happens when you allow banks to create magic money out of thin air to give to people who then bid up prices with it.