This post may contain affiliate links. As an Amazon Associate, we earn from qualifying purchases.
The job market is thriving, the stock market is performing well, and the haunting memories of the Great Recession are gradually receding. However, despite the overall economic growth, not everyone is reaping its benefits, particularly evident in the housing sector. Surprisingly, recent data from the U.S. Census Bureau’s American Community Survey for both 2007 and 2017 reveals that many states are still struggling to fully recover from the housing market downturn. In several regions across the country, the housing market has yet to surpass its 2007 levels.
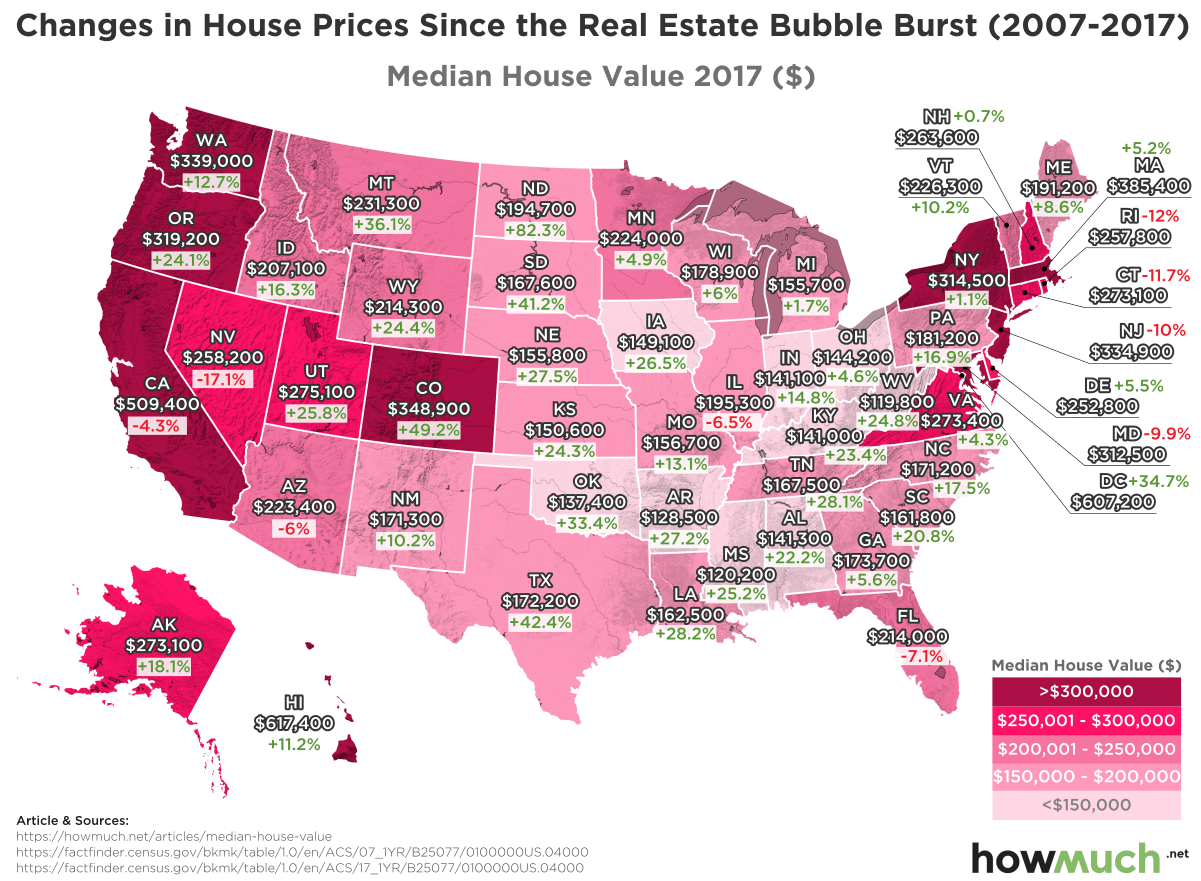
The maps below, created by the howmuch.net team, show the median housing values of each state in 2007 and 2017.
These maps offer a convenient means to swiftly observe a snapshot of the housing market both before and after the Great Recession. The initial image from 2007 presents median home values in a heat map, while the second image depicts prices as of 2017, along with the percentage change in value from a decade earlier. In 2008 and 2009, housing prices experienced a decline in nearly every region across the country.
Pre-bubble, the most affordable housing market was in the central U.S., between the costly West and East Coast. Housing prices, ranging from $106,800 in North Dakota to $120,900 in Texas, were relatively inexpensive. California stood out as the priciest mainland state, with a typical house costing $532,300. The Northeast, centered around New York, housed another cluster of expensive states, while the Upper Midwest around the Great Lakes region fell in between these extremes.
North Dakota (+82.3%), Colorado (+49.2%) and Texas (+42.4%) are among the few states that have seen a much more dramatic increase in housing prices. The median home values of states like Nevada (-17.1%), Rhode Island (-12.0%) and Connecticut (-11.7%) are still lower than they were before the real estate bubble burst.
State
Median house value, 2017 ($)
Median house value, 2007 ($)
Percentage change
NORTH DAKOTA
194700
106800
82.3
COLORADO
348900
233900
49.2
TEXAS
172200
120900
42.4
SOUTH DAKOTA
167600
118700
41.2
MONTANA
231300
170000
36.1
DISTRICT OF COLUMBIA
607200
450900
34.7
OKLAHOMA
137400
103000
33.4
LOUISIANA
162500
126800
28.2
TENNESSEE
167500
130800
28.1
NEBRASKA
155800
122200
27.5
ARKANSAS
128500
101000
27.2
IOWA
149100
117900
26.5
UTAH
275100
218700
25.8
MISSISSIPPI
120200
96000
25.2
WEST VIRGINIA
119800
96000
24.8
WYOMING
214300
172300
24.4
KANSAS
150600
121200
24.3
OREGON
319200
257300
24.1
KENTUCKY
141000
114300
23.4
ALABAMA
141300
115600
22.2
SOUTH CAROLINA
161800
133900
20.8
ALASKA
273100
231300
18.1
NORTH CAROLINA
171200
145700
17.5
PENNSYLVANIA
181200
155000
16.9
IDAHO
207100
178100
16.3
INDIANA
141100
122900
14.8
MISSOURI
156700
138600
13.1
WASHINGTON
339000
300800
12.7
HAWAII
617400
555400
11.2
VERMONT
226300
205400
10.2
NEW MEXICO
171300
155400
10.2
MAINE
191200
176000
8.6
WISCONSIN
178900
168800
6
GEORGIA
173700
164500
5.6
DELAWARE
252800
239700
5.5
PURTO RICO
109800
104400
5.2
MASSACHUSETTS
385400
366400
5.2
MINNESOTA
224000
213600
4.9
OHIO
144200
137800
4.6
VIRGINIA
273400
262100
4.3
MICHIGAN
155700
153100
1.7
NEW YORK
314500
311000
1.1
NEW HAMPSHIRE
263600
261800
0.7
CALIFORNIA
509400
532300
-4.3
ARIZONA
223400
237700
-6
ILLINOIS
195300
208800
-6.5
FLORIDA
214000
230400
-7.1
MARYLAND
312500
347000
-9.9
NEW JERSEY
334900
372300
-10
CONNECTICUT
273100
309200
-11.7
RHODE ISLAND
257800
292800
-12
NEVADA
258200
311300
-17.1
In total, median house prices now surpass 2007 levels in 41 states and Washington, DC. However, a closer look at the map reveals underwhelming growth, with 22 states seeing values increase by 20% or less over 10 years. Some areas experienced significant surges, such as North Dakota (+82.3%), Colorado (+49.2%), and Texas (+42.4%), driven by factors like shale fracking and population influx.
Yet, not all states share this positive trend. Nevada stands out, with median home values still 17.1% lower than pre-recession levels. Las Vegas, in particular, lacks appeal for both millennials and retiring baby boomers. Rhode Island (-12.0%), Connecticut (-11.7%), and New Jersey (-10.0%) also remain below their pre-recession levels.