That granite outcrop near your house? It probably crystallized underground 2 billion years ago. Limestone cliffs along the coast? Likely coral reefs from when the area was underwater. Geology maps help us figure out these timescales and reconstruct ancient environments.
I’ve been comparing three major global geology mapping projects. They take very different approaches to showing Earth’s 4-billion-year rock record.
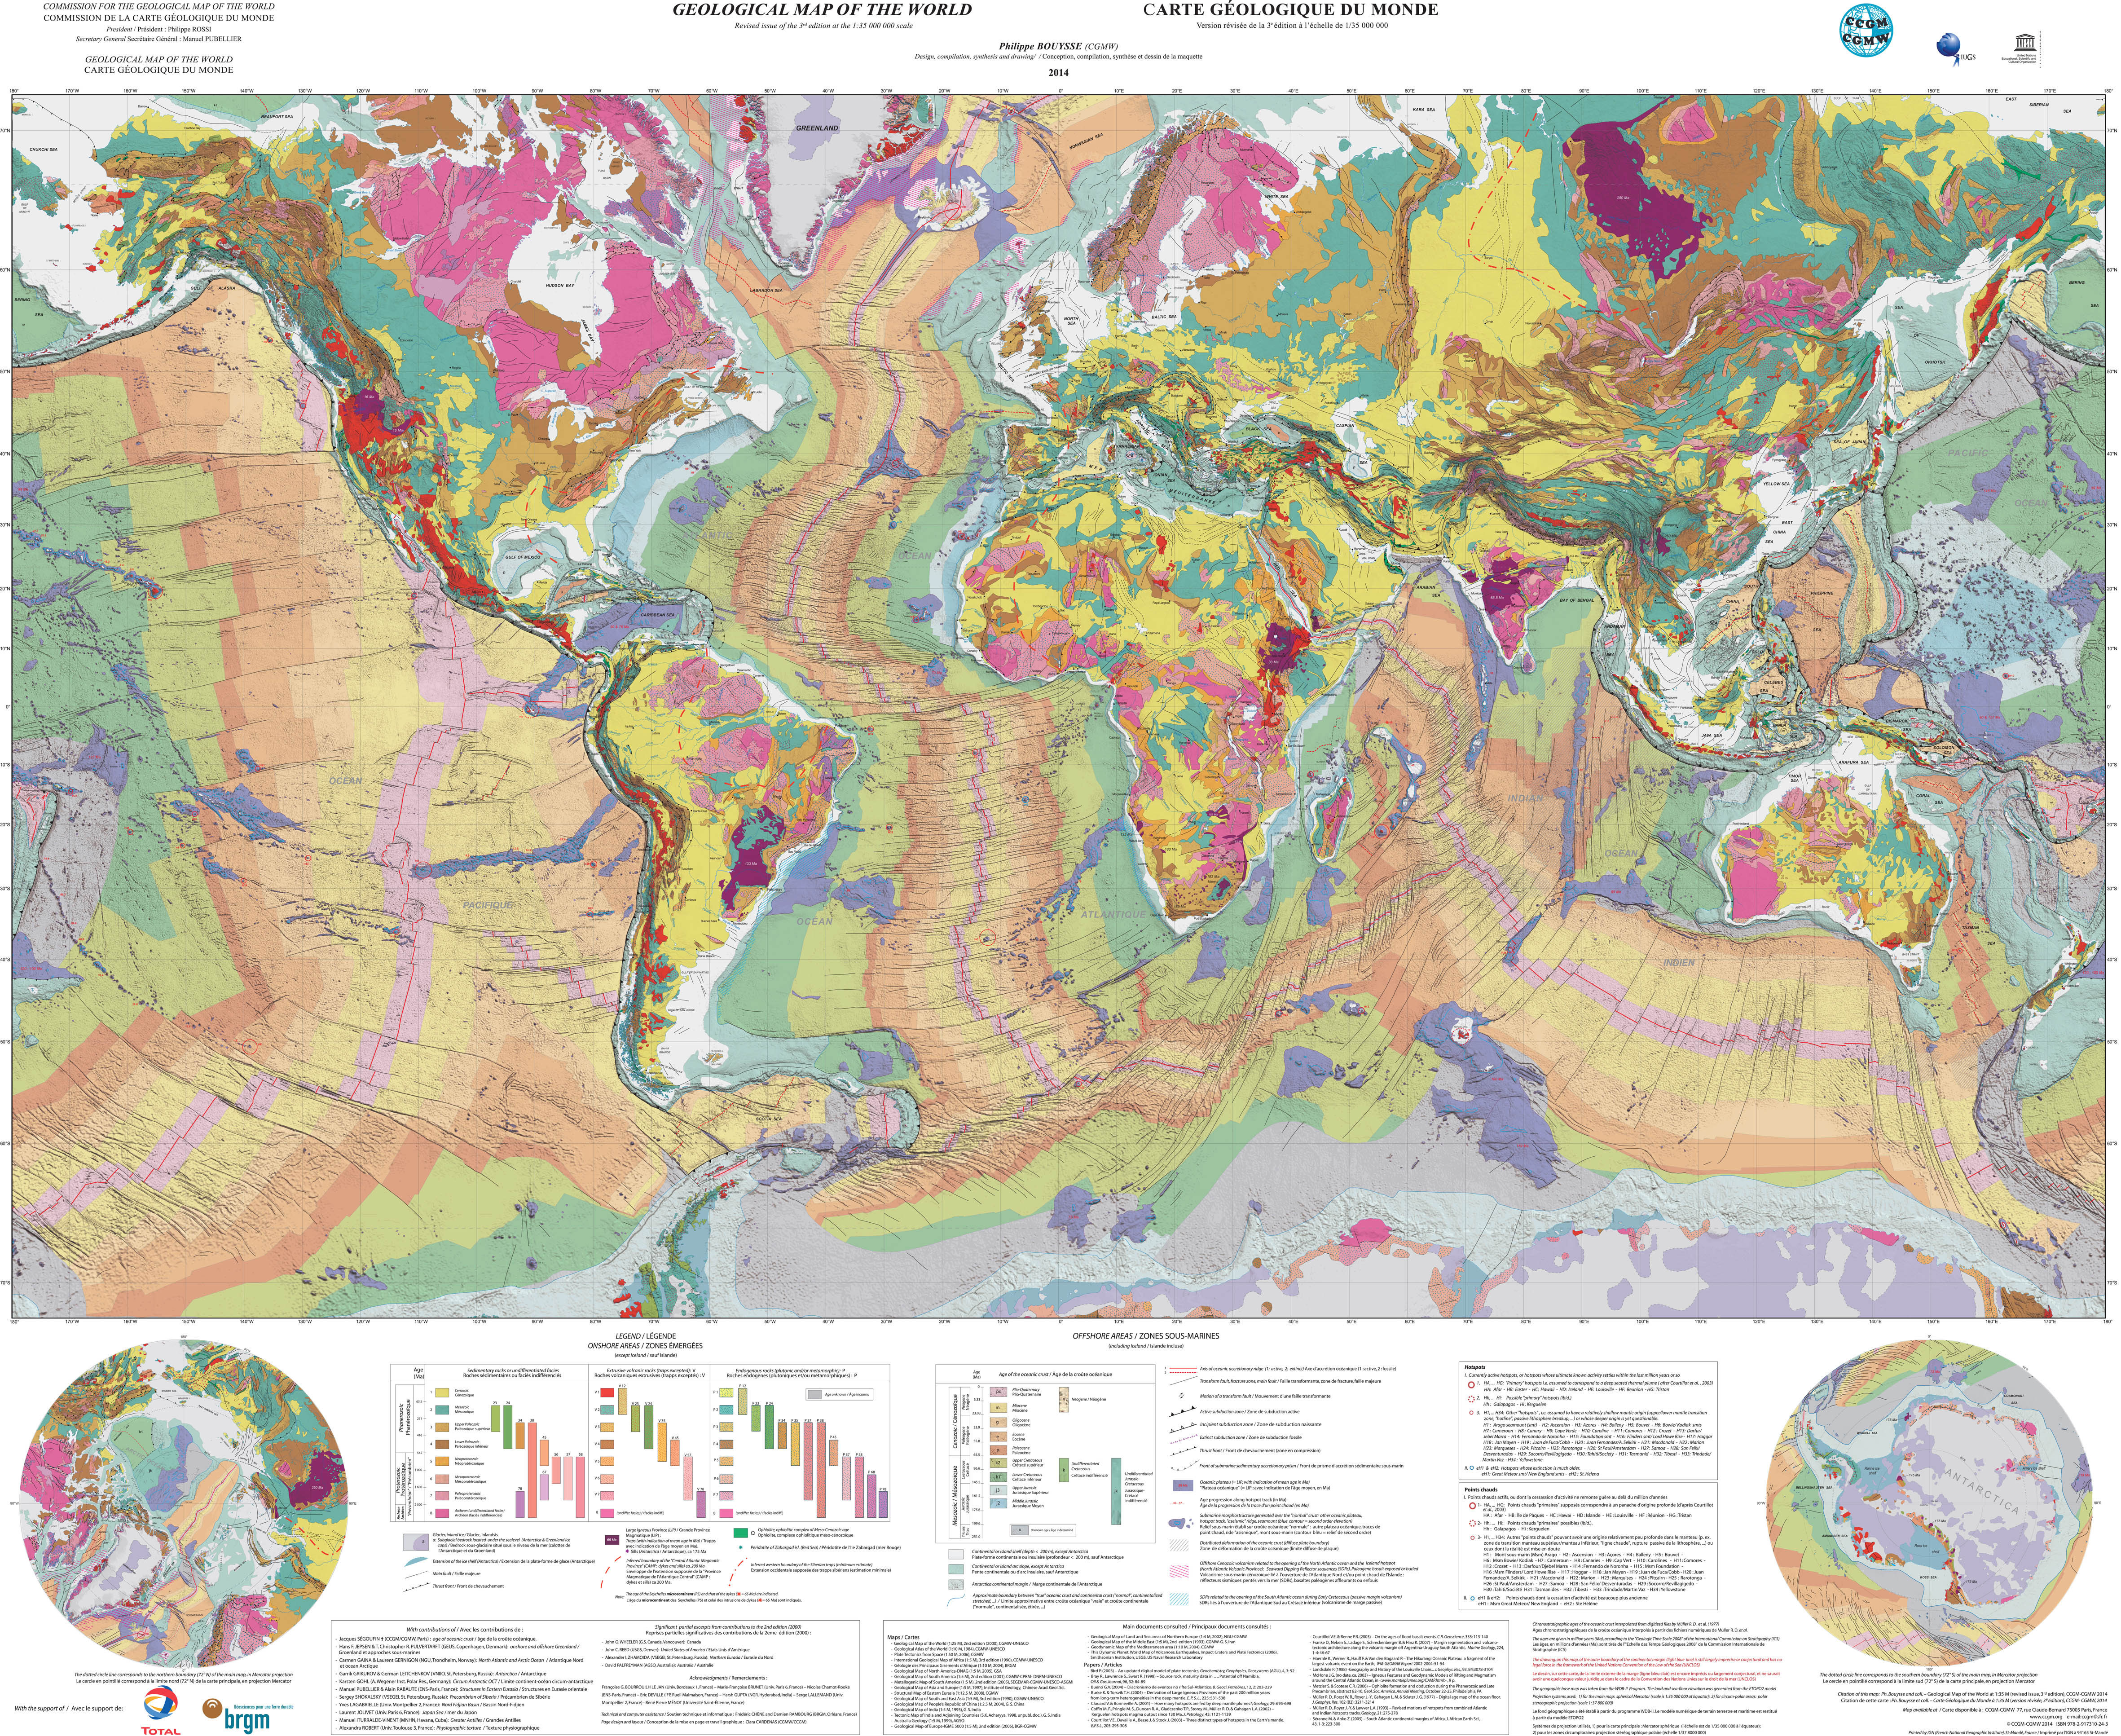
What caught my attention is how much ocean floor detail they included. Many geology maps concentrate on land masses, but CCGM added bathymetric shading that really highlights underwater features. The Mid-Atlantic Ridge shows up clearly. So do the subduction zones around the Pacific Rim and various oceanic plateaus from volcanic activity.
The color coding follows geological time periods. Purples and pinks = Precambrian (anything older than 541 million years). Greens and blues = Paleozoic era. Yellows through oranges = Mesozoic and Cenozoic, right up to active volcanoes. You can also see which rocks are sedimentary, which are metamorphic, and which are igneous. Plus there’s data on 45 hotspots and features like thrust faults.
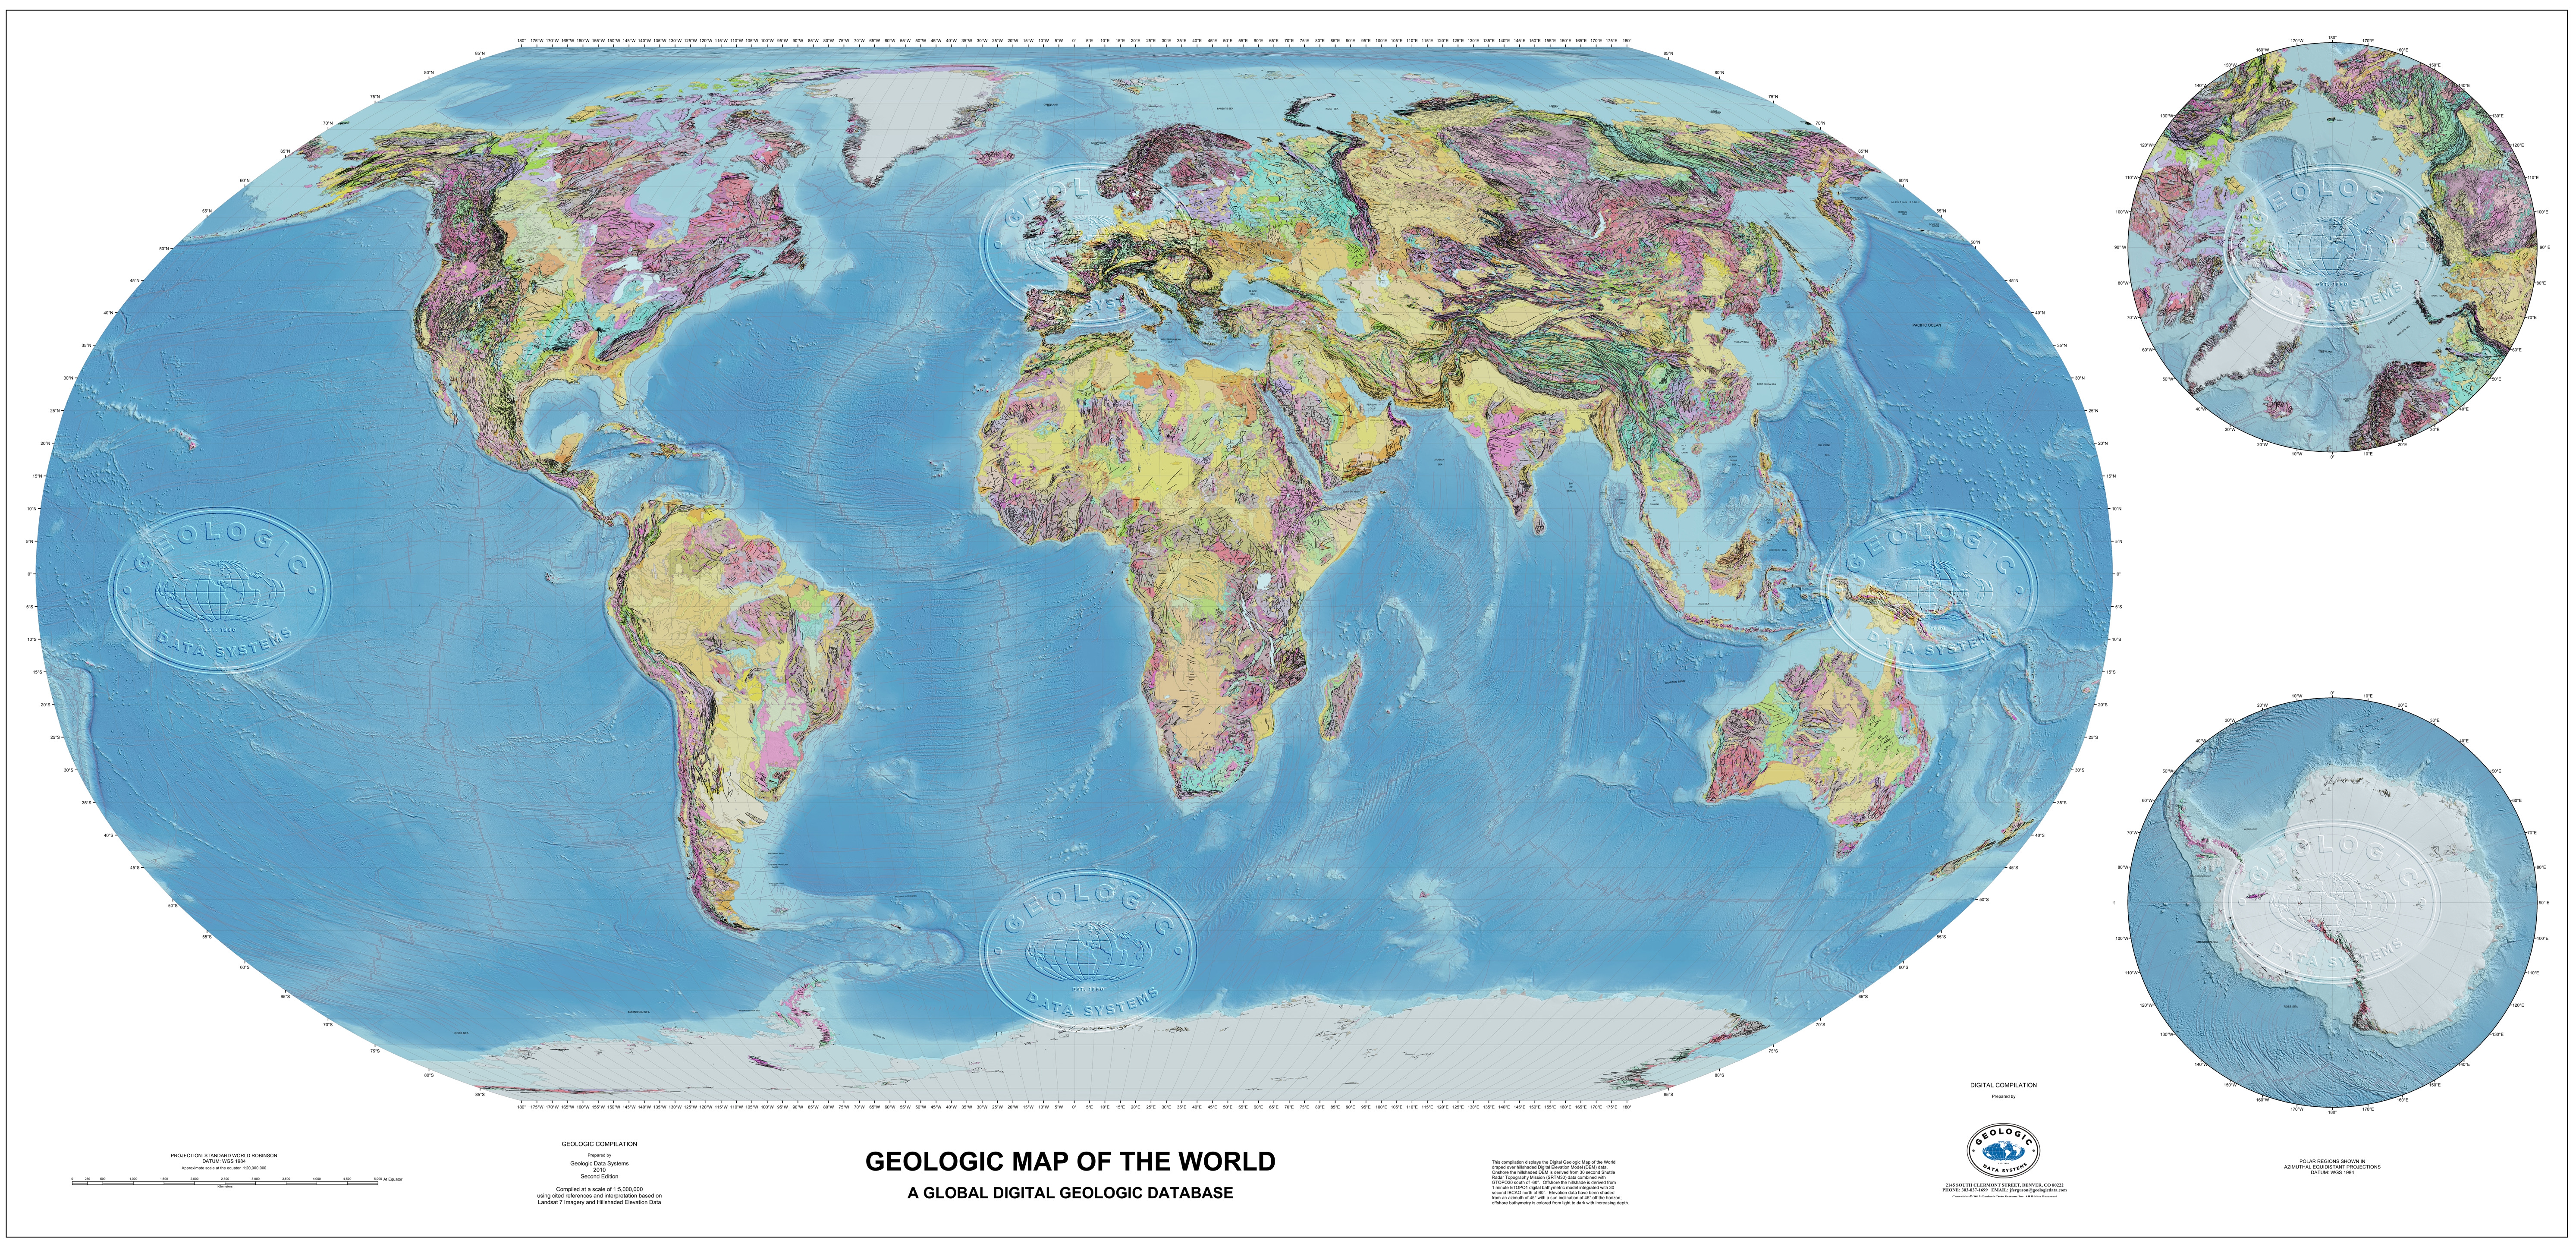
GDS Geologic Map of the World
Geologic Data Systems built their version by pulling from published surveys between 1:250,000 and 1:5,000,000 scale. They used SRTM30 elevation data for land, ETOPO1 for ocean depths, and Landsat imagery at 250m resolution as their base layers.
Here’s why I like this one: it comes as actual GIS files you can open in ArcGIS or QGIS.
For anyone doing spatial analysis or building custom maps, this is probably the most practical option. Import it, clip to your study area, overlay whatever else you need.
Macrostrat Interactive Geological Map
Macrostrat from UW-Madison works differently. Instead of one finished map, they built a database pulling from 200+ geological sources.
Click anywhere and you get bedrock info: formation name, lithology, age, plus links to papers about that unit. It connects to stratigraphic columns showing vertical rock sequences. Coverage is best for North America but expanding elsewhere.
You can switch between bedrock geology, stratigraphy, fossil localities from the Paleobiology Database, and other layers. They also made the Rockd app that uses your phone’s GPS to ID rocks in the field. Pretty useful when you’re hiking and wondering what you’re standing on.
The three projects serve different needs. Need authoritative reference? Go with CCGM. Working on GIS projects? GDS has the files. Want to explore interactively or check geology while traveling? Macrostrat and Rockd.