A tropical cyclone is a large-scale weather system characterized by a low-pressure center, strong winds, and intense thunderstorms. It is a type of cyclone that forms over warm tropical or subtropical ocean waters. Tropical cyclones are also known by different names in different regions, such as hurricanes in the Atlantic and northeastern Pacific, typhoons in the northwestern Pacific, and cyclones in the Indian Ocean and South Pacific.
Tropical cyclones are fueled by the transfer of heat from the ocean to the atmosphere. Warm, moist air rises rapidly from the ocean’s surface, creating an area of low pressure. As the air rises, it cools and condenses, forming towering cumulonimbus clouds and releasing large amounts of energy in the form of latent heat. This energy drives the strong winds and heavy rainfall associated with tropical cyclones.
The basic structure of a tropical cyclone consists of an organized system of rotating winds around a well-defined center called the eye. The eye is a relatively calm and clear area, typically surrounded by a dense ring of intense thunderstorms known as the eyewall. Beyond the eyewall, there are spiral rainbands that extend outward from the center.
Tropical cyclones can cause significant damage due to their strong winds, storm surge (a rise in sea level), and heavy rainfall, which can lead to flooding. They are classified based on their maximum sustained wind speeds using various scales, such as the Saffir-Simpson Hurricane Wind Scale (for hurricanes) or the Beaufort scale.
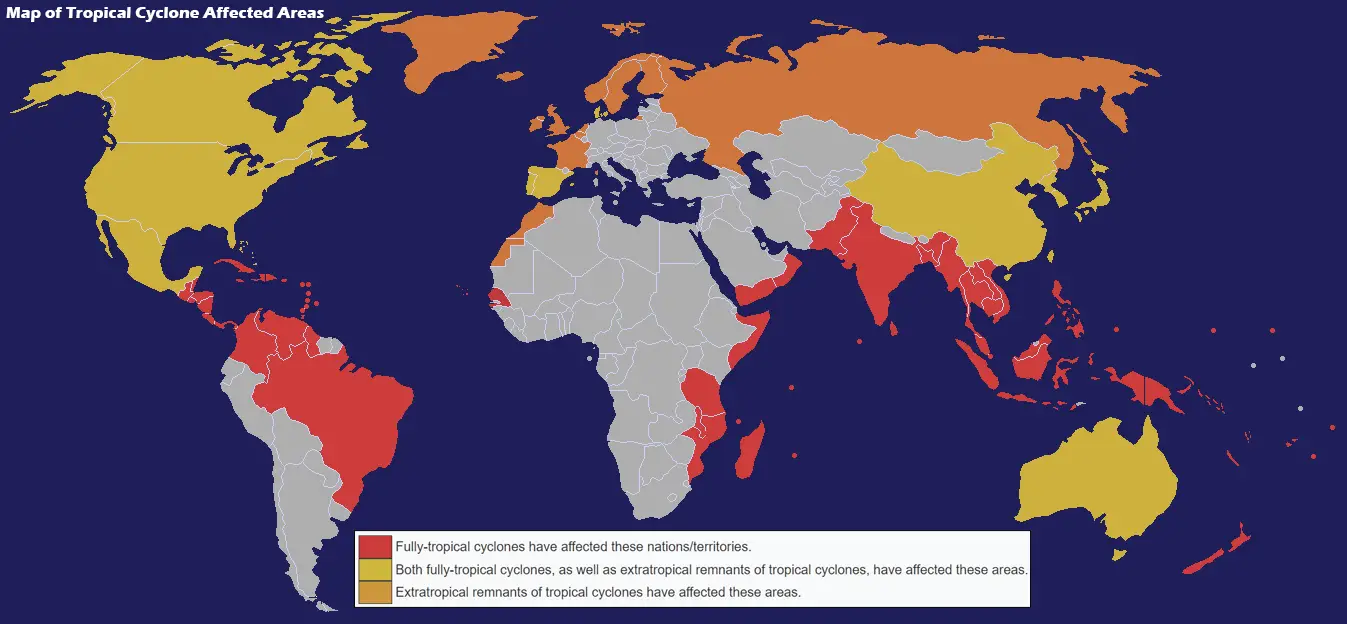
The map shows that the Atlantic coast of North America and the Pacific coast of eastern Asia experience the highest number of cyclones in the tropics. Here is the map of tropical cyclone affected areas.
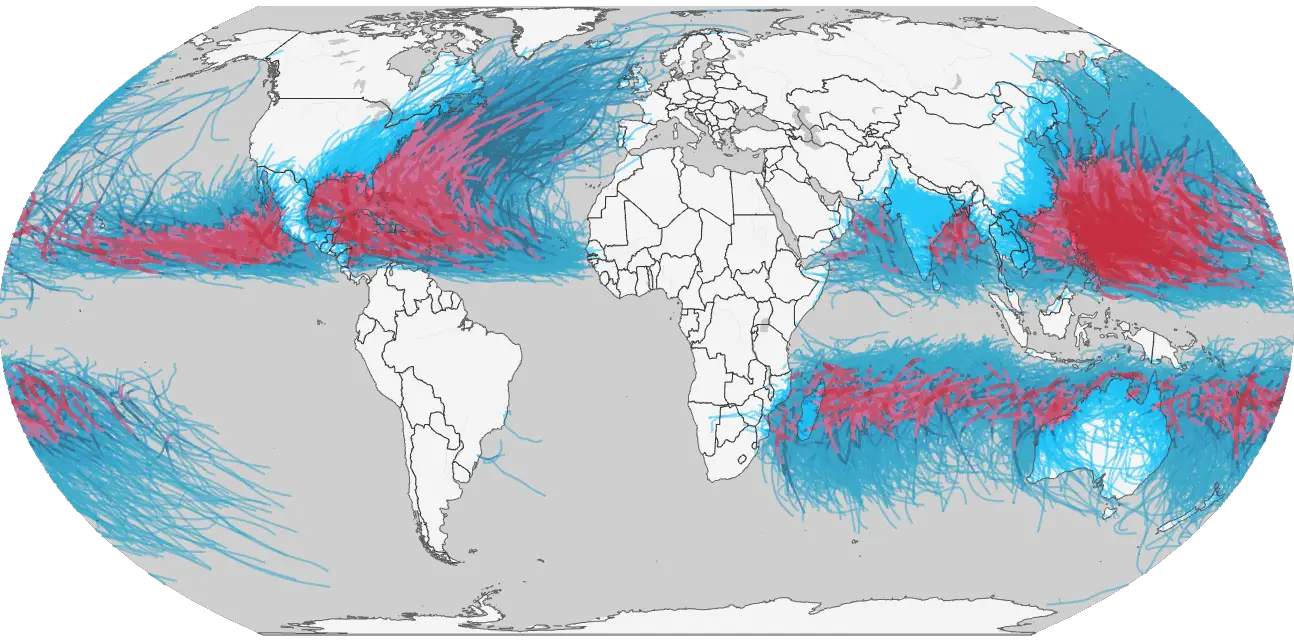
The animation below shows the reported track and intensity of every tropical cyclone reported in the IBTrACS database from 1950 to 2018.
Sustained wind speeds on the map above are presented according to the Saffir-Simpson scale indicating tropical depression (TD), tropical storm (TS), and hurricane-force winds (Categories 1 – 5).
This map clearly illustrates that some ocean basins are highly prone to the formation of tropical cyclones, while other ocean basins see few or no such storms. These differences are generally due to differences in ocean water temperatures and prevailing wind conditions. Cyclone formation is most common in the summer months when ocean water is typically warmer.


?")


