America’s Most Common Road Suffixes, Mapped
America’s 4 million miles of roads aren’t just pavement—they’re history. Discover what road names reveal about our towns, cities, and regions.
Read More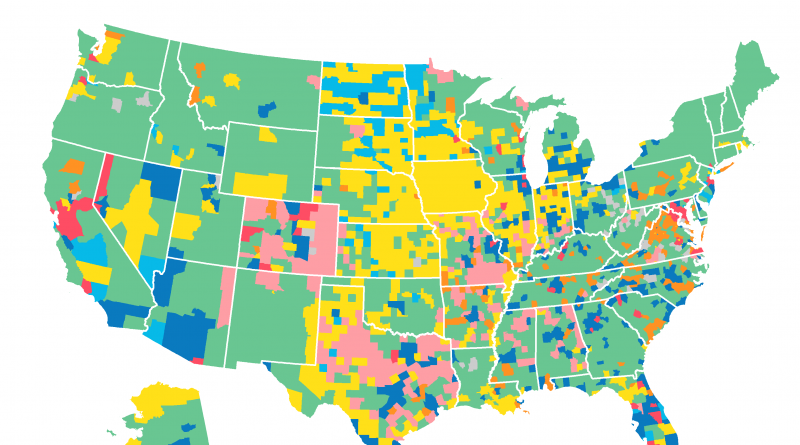
America’s 4 million miles of roads aren’t just pavement—they’re history. Discover what road names reveal about our towns, cities, and regions.
Read More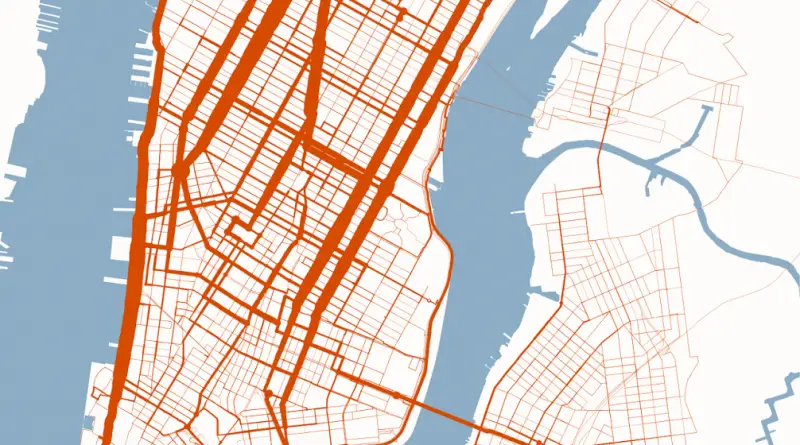
Related posts: – New York Citi bike most popular roads (Sep – Nov 2015) – New York Citi Bike Rebalancing
Read MoreThis interactive visualisation aims to display traffic accident information as kept by Transport for London for the year 2015. The
Read MoreIn creating the ever-growing Adventure Cycling Route Network, members of Adventure Cycling Association researched and developed 45,003 miles of prime
Read More
People made 1.35 billion journeys on London’s iconic tube network last year. Every weekday, London sees 2 million people commuting
Read More
In a densely populated area formed roughly by Dallas, San Antonio, Houston, and Austin lies the Texas Triangle. Outlined by
Read MoreThese maps, each centered on a great American city, are as many time travel maps. Using data from the June
Read More
People made 1.35 billion journeys on London’s iconic tube network last year. Every weekday, London sees 2 million people commuting
Read MoreWithin the Downtown and East York regions of Toronto, during 2015 enforcement officers issued over $68.6 million in parking fines
Read More