Satellite Eyes on Brazil’s Vanishing Forests: Mapping a Crisis
From 438 miles above Earth, NASA’s satellites capture what we can’t see from the ground: the true scale of Brazil’s vanishing forests. These images transform abstract statistics into visual evidence that no ground-level photo could convey.
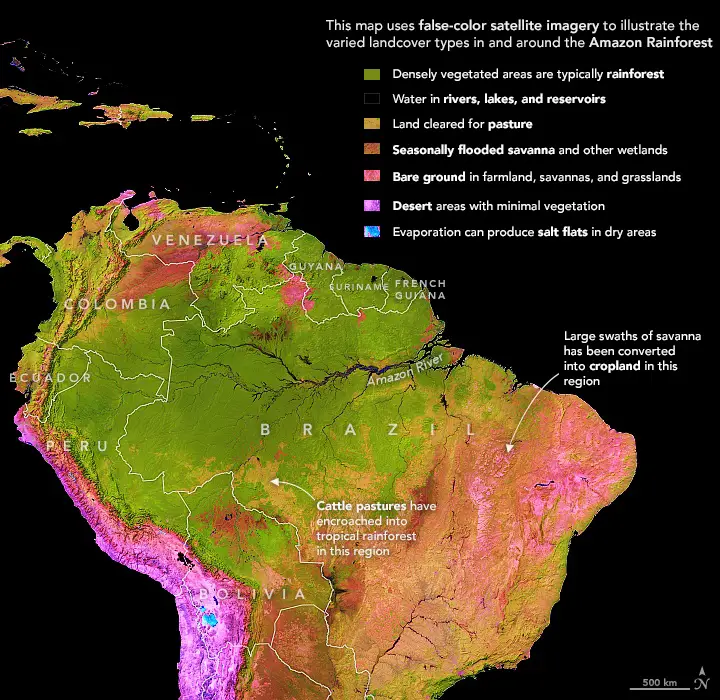
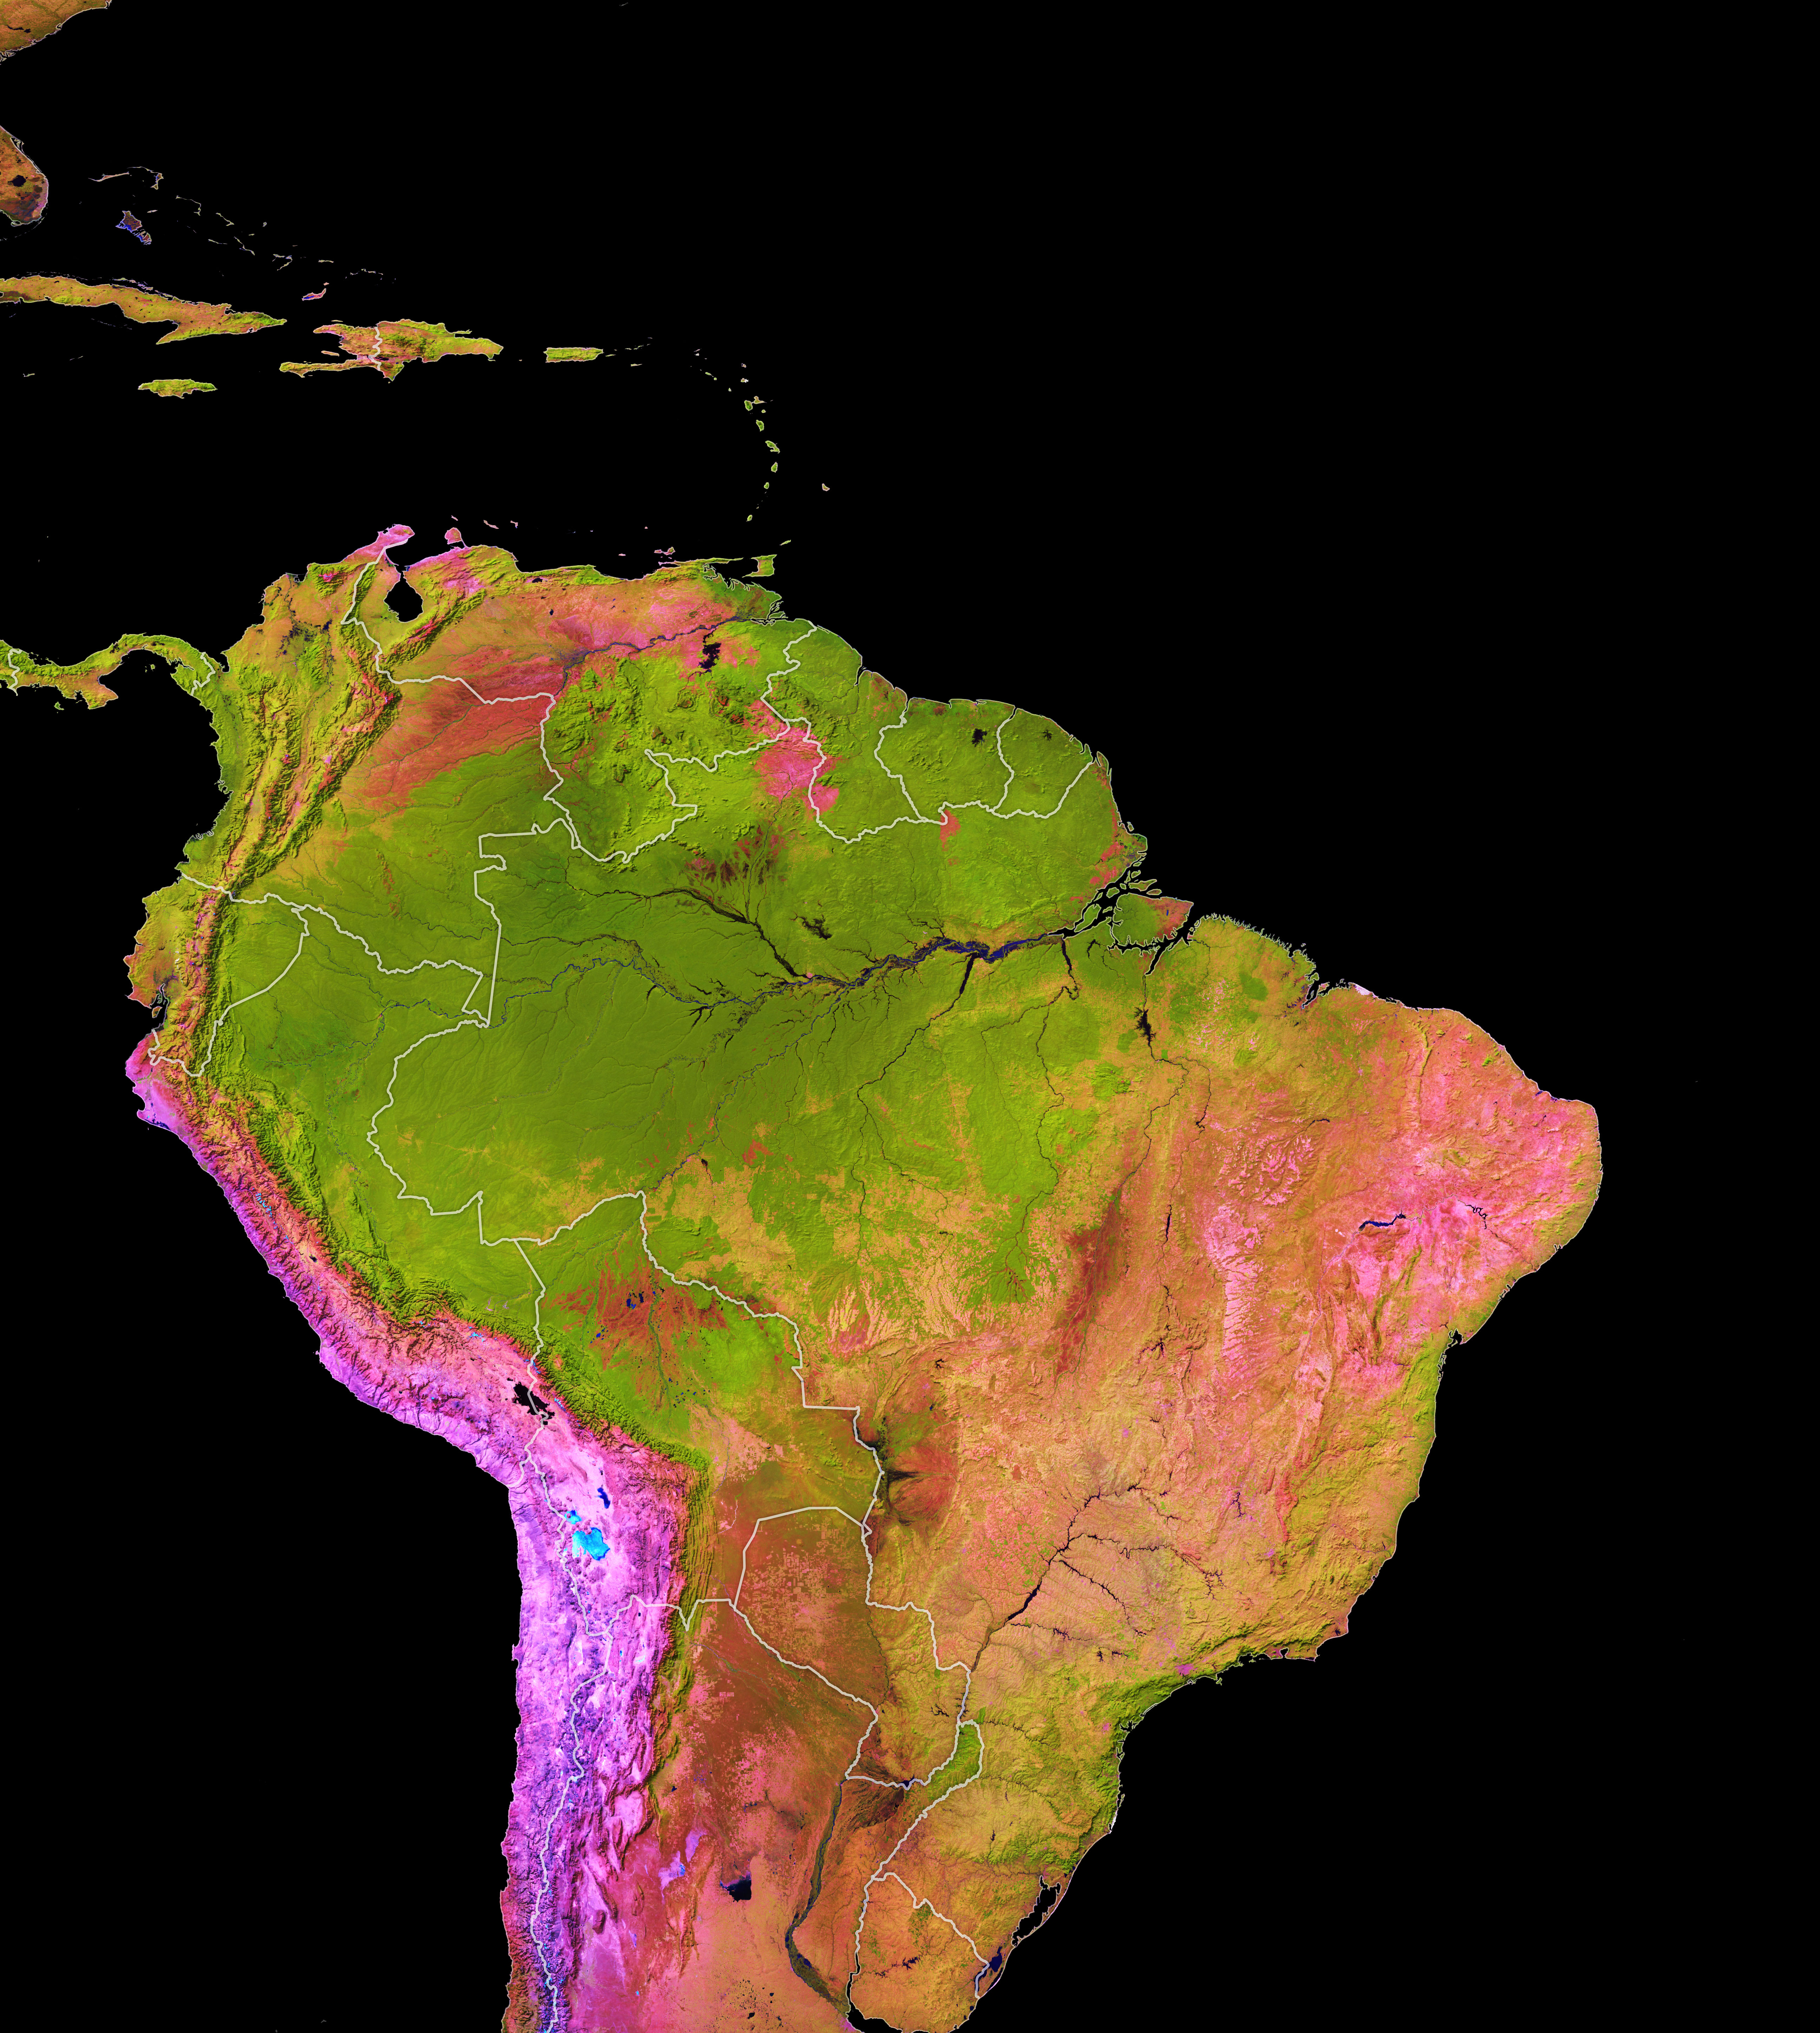
The Amazon Rainforest stretches across 6.7 million square kilometers (2.6 sq mi) —an area roughly two-thirds the size of the continental United States. The false-color satellite imagery reveals intact forest in deep emerald green, while cleared areas appear as pale, jagged scars cutting through the canopy. These scars now cover nearly 20% of what was once continuous forest, primarily cleared for cattle ranching, soy farming, and illegal logging.
Even more dramatic is the Atlantic Forest’s transformation. Satellite mapping shows that a forest that once covered 1.2 million square kilometers (0.5 sq mi) along Brazil’s coast now exists primarily as isolated fragments, with 88% of its original cover lost to development.

When we overlay historical vegetation maps with current satellite imagery, the contrast is clear—what was once a continuous green belt is now a patchwork of small islands surrounded by urbanization and agriculture.
The Acceleration of Loss
Deforestation in the Amazon hasn’t maintained a steady pace. In the early 2000s, Brazil achieved remarkable success, reducing annual clearing by 80% through policy interventions and satellite monitoring systems. Looking at the year-by-year data from NASA, you can actually see the slowdown in real time—fewer new cleared areas appearing each year.
But since 2019, the data reveal a troubling shift. Annual clearing rates have surged again, hitting a 15-year high in 2022. The spatial pattern has changed too—deforestation is pushing deeper into previously untouched areas, creating new frontiers of forest loss. In 2023 alone, satellite data revealed that an area roughly the size of Delaware (about 5,130 square kilometers or 1,981 square miles) was lost.
The Atlantic Forest’s cartographic history follows a different trajectory. Most of its destruction occurred before modern satellite monitoring, driven by colonial-era urbanization and sugarcane plantations. Today’s maps show that less than 12% remains, and what’s left is severely fragmented.
What These Maps Reveal: Three Critical Systems at Risk
When we analyze these forest maps as systems rather than just areas, three critical planetary functions come into focus:
- Carbon Storage and Climate Regulation: The Amazon’s canopy, visible as that continuous green expanse on satellite imagery, stores an estimated 150 billion metric tons of carbon. Climate models mapped onto deforestation scenarios show that losing much more forest could push the Amazon past a tipping point—transforming from carbon sink to carbon source and accelerating climate change. You can actually see these transitions beginning in the yellowish-brown areas of enhanced vegetation index maps, where forest degradation is altering the ecosystem’s fundamental carbon cycling.
- Biodiversity Hotspots: The Atlantic Forest may appear small on continental-scale maps, but zoom in and you’ll find it hosts 7% of Earth’s plant and animal species. Conservation priority maps show the remaining fragments in deep red—indicating their irreplaceable value for endangered species like the golden lion tamarin. Each isolated green patch on the satellite image represents an island of biodiversity fighting for survival.
- Hydrological Cycles: Perhaps the most invisible function these forests serve becomes visible through precipitation pattern maps. Both forests generate “flying rivers”—massive aerial waterways that transport moisture across South America. Satellite data of water vapor movement show how deforestation disrupts these patterns, potentially triggering agricultural crises as far south as Argentina’s breadbasket regions.
Mapping a Different Future
Restoration efforts are also leaving their mark on the maps. In the Atlantic Forest, reforestation projects have added back approximately 1 million hectares since 2000—visible as small but growing patches of green in time-lapse satellite imagery. Conservation priority mapping tools now guide these efforts, identifying critical corridors that can reconnect isolated fragments.
For the Amazon, Brazil’s current government has pledged to end illegal deforestation by 2030. Satellite monitoring will be the accountability tool—allowing anyone with an internet connection to track whether these promises are becoming reality. Already, systems like Global Forest Watch overlay property boundaries with deforestation alerts, creating unprecedented transparency.


