Every October, the State Department opens a short online form. Anyone from an eligible country can fill it out at no cost. A computer draws the winners a few months later. No job offer required, no relative already living in the country needed, just a name pulled at random from millions of others.
The Diversity Immigrant Visa, known almost everywhere as the green card lottery, began with the Immigration Act of 1990 and held its first drawing in 1995. It awards up to 55,000 permanent residencies a year to people from countries that send few other immigrants to the United States, and it has moved more than 1.4 million people into the country since it started.
Green Card Lottery at a Glance
Signed into law in 1990, first drawing held for fiscal year 1995
Grew out of a 1980s effort to help Irish applicants shut out by the 1965 immigration law
Up to 55,000 visas a year on paper, actual totals have ranged from 18,912 to 55,993
Africa has taken the largest regional share almost every year since the program began
Over 22 million people apply most years, fewer than 1 in 400 receive a visa
More than 1.4 million people have won since 1995, close to 0.4 percent of the current U.S. population
When did the green card lottery start, and why?
The program traces back to Irish immigration specifically, not diversity as a general goal. The 1965 Immigration and Nationality Act scrapped the national-origin quotas that had favored Northern Europe and replaced them with a system built on family ties and job skills. Irish arrivals in the 1980s often had neither. Many came on tourist visas and stayed on without legal status, with no route forward under the new rules.
Congressmen Brian Donnelly, Howard Berman, and Bruce Morrison each sponsored a temporary lottery to fix this between 1987 and 1994. The largest of the three, the Morrison program, set aside 40 percent of its 120,000 visas, 48,000 in total, for natives of Ireland and Northern Ireland. Poland placed a distant second by volume of applicants, and the Irish government lobbied hard for all three programs. The Immigration Act of 1990 then turned the idea into a permanent, worldwide lottery rather than one aimed at a single country, and it has continued every year since.
How many people win the green card lottery each year, and from where?
Up to 55,000 visas are available annually, minus a small carve-out for other programs, so the actual number issued in a given year typically lands between 45,000 and 56,000. More than 22 million people register in a typical year, which works out to fewer than 1 in 400 applicants actually receiving a visa.
No single country can dominate the results. A rule caps any one nation at 7 percent of the year’s total, about 3,840 visas. Regions tell a cleaner story than countries do. Africa has taken the largest regional share almost every year of the program’s history, sending more than 500,000 people to the United States through the lottery since 1995. Among individual nations, the U.S. Department of State’s data shows that countries like Uzbekistan, Egypt, and Iran consistently hit the highest maximum selectee caps, while Nepal remains the top-ranking source country in South Asia.
Which Years Saw the Most and Fewest Winners?
FY2023 holds the record, with 55,993 diversity visas issued, the highest total since the program began. FY2021 marks the opposite extreme, with just 18,912 issued, the lowest ever recorded.
In April 2020, Presidential Proclamation 10014 suspended most immigrant entry to protect the U.S. labor market during the pandemic, and later extensions kept it in place into early 2021. Consulates were also closed or working at reduced capacity for much of that stretch. Unused diversity visa numbers cannot roll into the next fiscal year the way family or employment visas can.
Fiscal Year
Diversity Visas Issued
1995
55,058
2019
45,889
2020
19,125
2021
18,912
2022
55,882
2023
55,993
2024
54,554
How many people have won the green card lottery overall?
Adding up every fiscal year from the first drawing in 1995 through 2024 gives a total of roughly 1.42 million diversity visas issued, principals and their family members combined. Measured against the 2025U.S. population estimate of about 341.8 million, that comes to roughly 0.4 percent of everyone currently counted in the country, or about 4 in every 1,000 people. Africa alone accounts for more than 500,000 of that total.
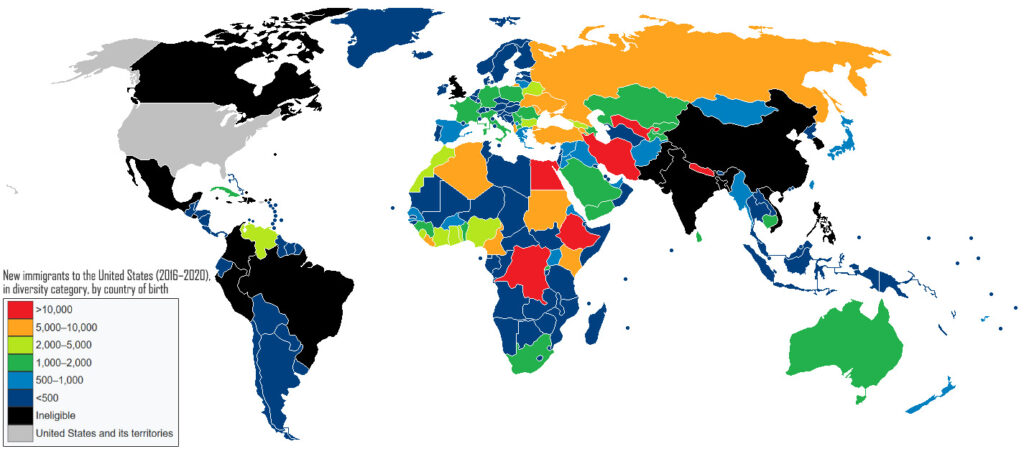
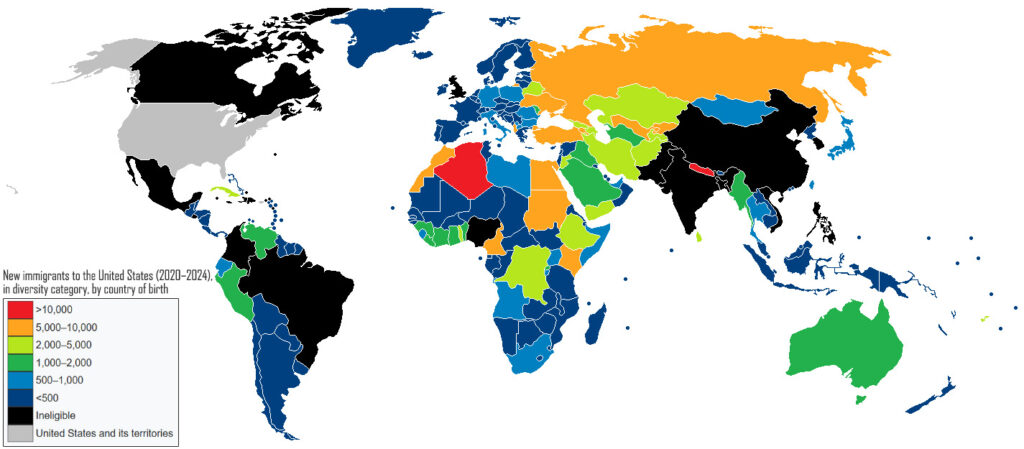
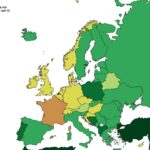
Changes in the diversity visa world map between 2019 and 2024
Six countries, Uzbekistan, Iran, Nepal, Egypt, Ethiopia, and the Democratic Republic of the Congo, each sent more than 10,000 diversity immigrants to the United States in the five years ending in 2019. By the five years ending in 2024, only Nepal and Algeria remained above that line.
Country
Five Years Ending FY2019
Five Years Ending FY2024
Nepal
16,905
13,213
Egypt
16,669
9,232
Democratic Republic of the Congo
14,058
3,434
Uzbekistan
10,982
8,044
Ethiopia
10,974
2,985
Iran
8,171
5,271
Algeria
6,361
10,231
The pandemic-era collapse described above sits behind nearly every one of these declines.
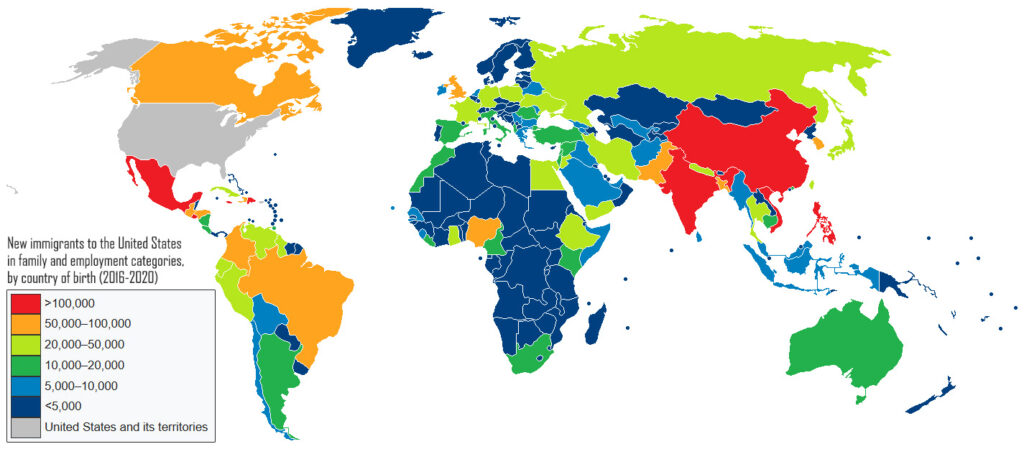
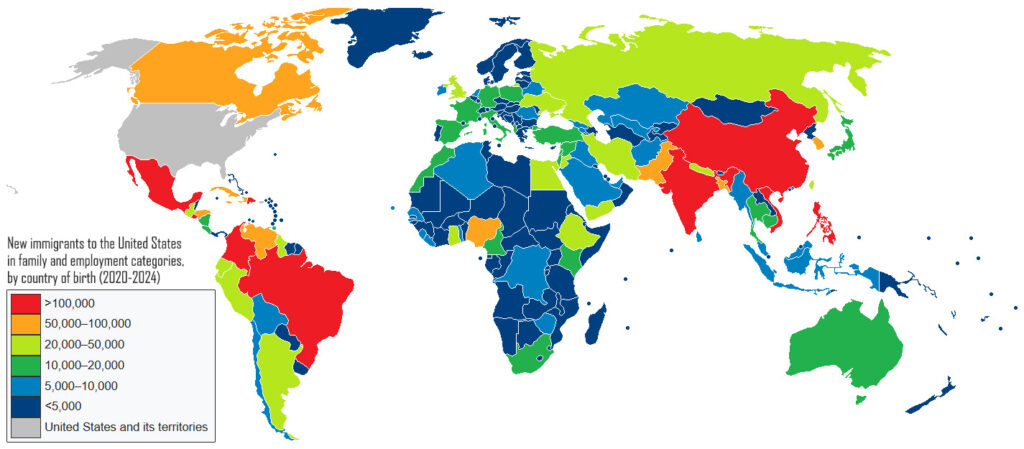
Why did family and employment immigration climb in the same years?
Mexico, China, India, Vietnam, and the Philippines each passed 100,000 new immigrants in the family and employment categories combined, over the five years ending in 2019. By the five years ending in 2024, El Salvador, Colombia, and Brazil had joined that group. The same pandemic shutdown that permanently erased diversity visas had close to the opposite effect here, because unused family and employment visa numbers do not expire. They roll into the following year, or shift into the other category entirely.
Country of Birth
New Permanent Residents, FY2019
New Permanent Residents, FY2023
Mexico
156,050
180,530
India
54,500
78,070
Philippines
45,920
49,200
China
62,250
59,260
Vietnam
39,710
36,000
Brazil
19,830
28,880
Colombia
19,840
24,810
El Salvador
27,660
26,210
This table covers every immigration category combined, not family and employment alone.
By 2022, the National Visa Center’s backlog of completed cases waiting on an interview had grown roughly sixfold from its 2019 average, peaking near 566,000. The government spent the next two years pushing that deferred demand through the system. In FY2023 alone, the State Department and USCIS issued more than 192,000 employment-based visas, a record, after rolling roughly 57,000 unused family-sponsored numbers from the prior year onto the employment total. Brazil, Colombia, and El Salvador all now sit on the diversity lottery’s own list of countries too large to qualify for it, a status set using this exact five-year, family-and-employment count.
Is the green card lottery still active right now?
Not entirely. The State Department suspended diversity visa issuance in December 2025 following a shooting in which the suspect had immigrated through the program. A federal court ordered the pause lifted on August 28, 2026, with a hard September 30, 2026 deadline for that cycle’s winners to secure their visas, and the legal fight over the broader suspension was still active as this was written. Anyone tracking the program should check the State Department’s diversity visa news page directly for the current status.