World Happiness Report (2017)
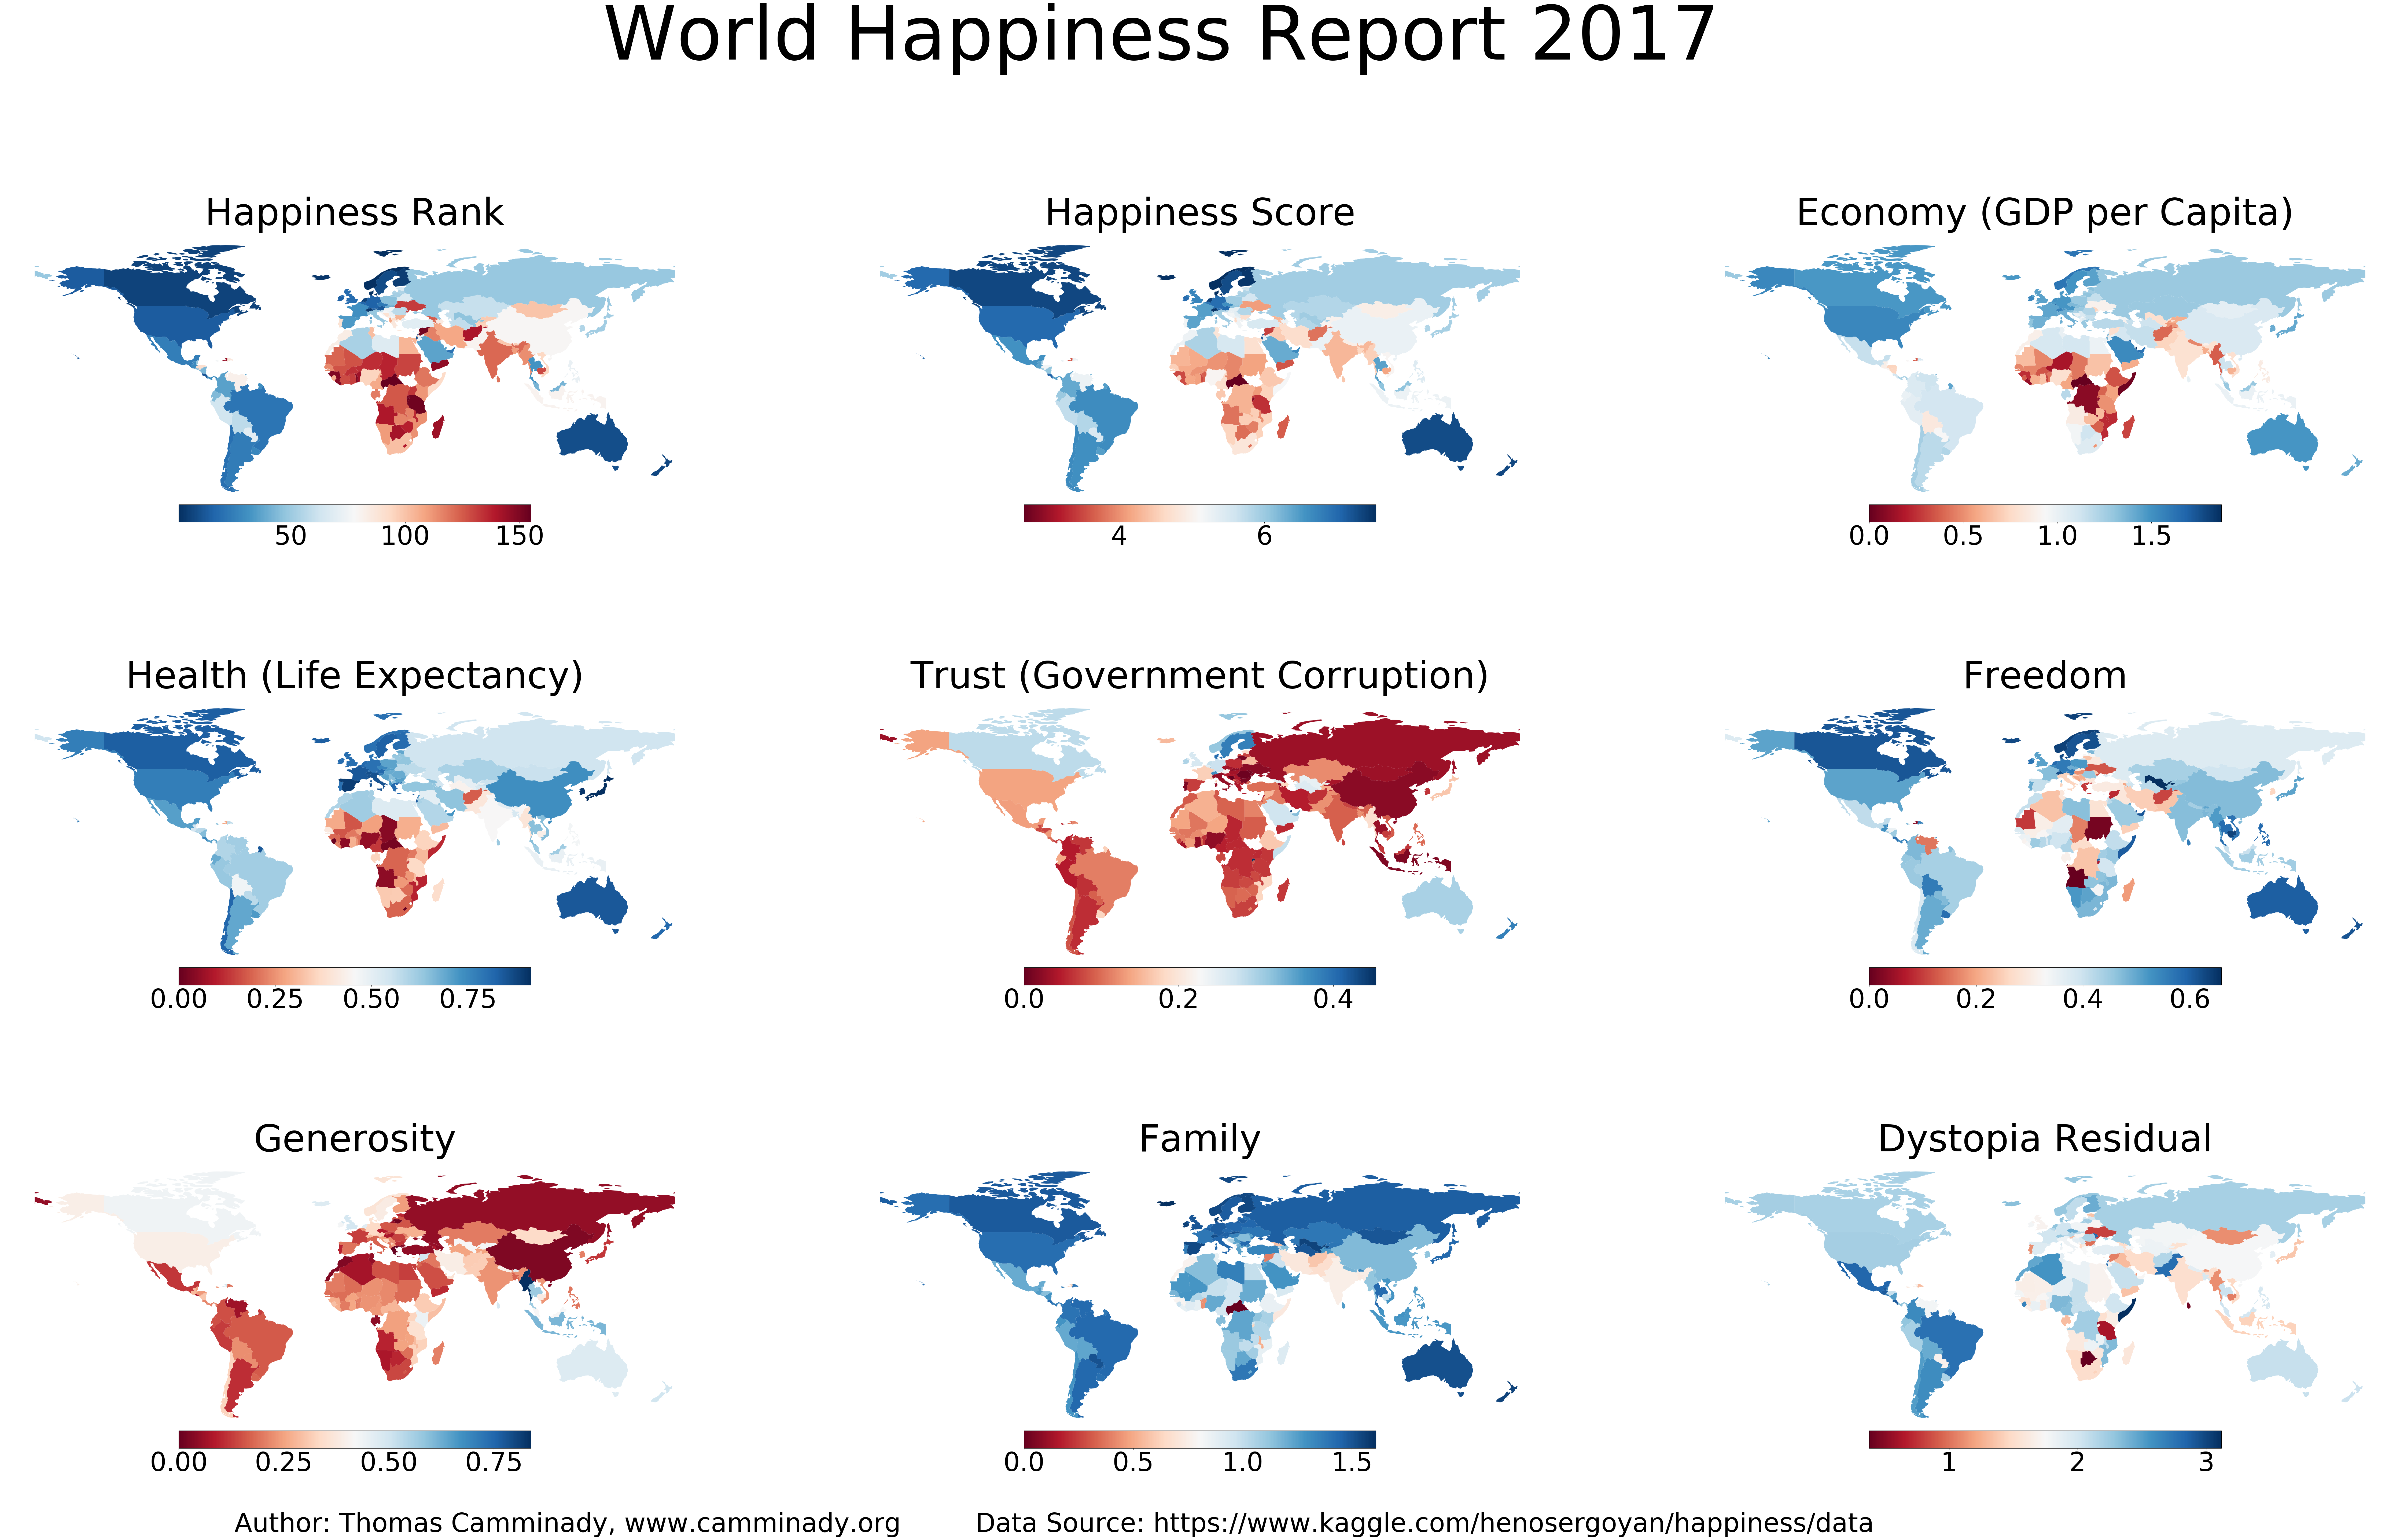
The Happiness Index is based on variables: GDP per capita, social support, healthy life, expectancy, freedom, generosity, and absence of corruption.
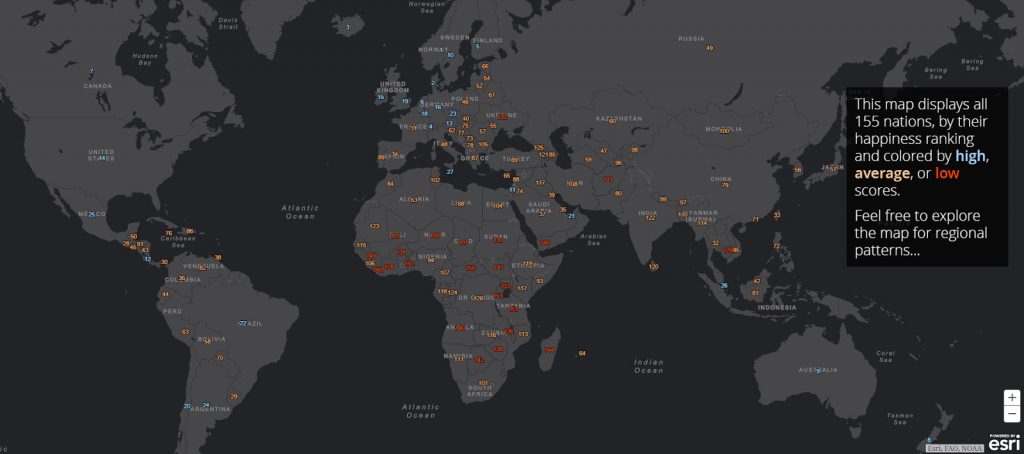
The map below displays all 155 nations, by their happiness ranking and colored by high, average, or low scores.
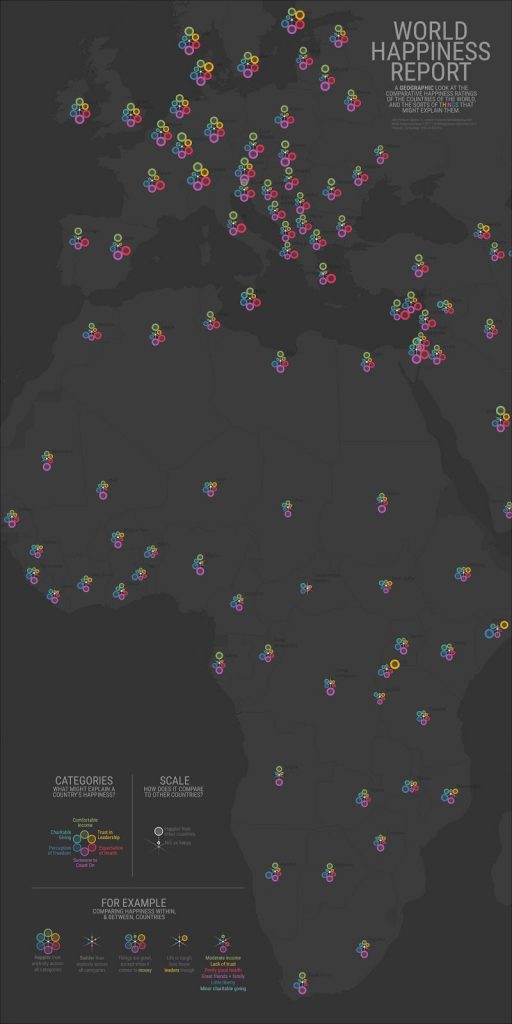
Happiness = “Income” + “A sense of trust in business and government” + “The expectation of good health” + “A personal network of social support” + “The perception of freedom” + “Giving and generosity”.


1. Norway (7.537)
2. Denmark (7.522)
3. Iceland (7.504)
4. Switzerland (7.494)
5. Finland (7.469)
6. Netherlands (7.377)
7. Canada (7.316)
8. New Zealand (7.314)
9. Australia (7.284)
10. Sweden (7.284)
11. Israel (7.213)
12. Costa Rica (7.079)
13. Austria (7.006)
14. United States (6.993)
15. Ireland (6.977)
16. Germany (6.951)
17. Belgium (6.891)
18. Luxembourg (6.863)
19. United Kingdom (6.714)
20. Chile (6.652)
21. United Arab Emirates (6.648)
22. Brazil (6.635)
23. Czech Republic (6.609)
24. Argentina (6.599)
25. Mexico (6.578)
26. Singapore (6.572)
27. Malta (6.527)
28. Uruguay (6.454)
29. Guatemala (6.454)
30. Panama (6.452)
31. France (6.442)
32. Thailand (6.424)
33. Taiwan (6.422)
34. Spain (6.403)
35. Qatar (6.375)
36. Colombia (6.357)
37. Saudi Arabia (6.344)
38. Trinidad and Tobago (6.168)
39. Kuwait (6.105)
40. Slovakia (6.098)
41. Bahrain (6.087)
42. Malaysia (6.084)
43. Nicaragua (6.071)
44. Ecuador (6.008)
45. El Salvador (6.003)
46. Poland (5.973)
47. Uzbekistan (5.971)
48. Italy (5.964)
49. Russia (5.963)
50. Belize (5.956)
51. Japan (5.920)
52. Lithuania (5.902)
53. Algeria (5.872)
54. Latvia (5.850)
55. Moldova (5.838)
56. South Korea (5.838)
57. Romania (5.825)
58. Bolivia (5.823)
59. Turkmenistan (5.822)
60. Kazakhstan (5.819)
61. North Cyprus (5.810)
62. Slovenia (5.758)
63. Peru (5.715)
64. Mauritius (5.629)
65. Cyprus (5.621)
66. Estonia (5.611)
67. Belarus (5.569)
68. Libya (5.525)
69. Turkey (5.500)
70. Paraguay (5.493)
71. Hong Kong (5.472)
72. Philippines (5.430)
73. Serbia (5.395)
74. Jordan (5.336)
75. Hungary (5.324)
76. Jamaica (5.311)
77. Croatia (5.293)
78. Kosovo (5.279)
79. China (5.273)
80. Pakistan (5.269)
81. Indonesia (5.262)
82. Venezuela (5.250)
83. Montenegro (5.237)
84. Morocco (5.235)
85. Azerbaijan (5.234)
86. Dominican Republic (5.230)
87. Greece (5.227)
88. Lebanon (5.225)
89. Portugal (5.195)
90. Bosnia and Herzegovina (5.182)
91. Honduras (5.181)
92. Macedonia (5.175)
93. Somalia (5.151)
94. Vietnam (5.074)
95. Nigeria (5.074)
96. Tajikistan (5.041)
97. Bhutan (5.011)
98. Kyrgyzstan (5.004)
99. Nepal (4.962)
100. Mongolia (4.955)
101. South Africa (4.829)
102. Tunisia (4.805)
103. Palestinian Territories (4.775)
104. Egypt (4.735)
105. Bulgaria (4.714)
106. Sierra Leone (4.709)
107. Cameroon (4.695)
108. Iran (4.692)
109. Albania (4.644)
110. Bangladesh (4.608)
111. Namibia (4.574)
112. Kenya (4.553)
113. Mozambique (4.550)
114. Myanmar (4.545)
115. Senegal (4.535)
116. Zambia (4.514)
117. Iraq (4.497)
118. Gabon (4.465)
119. Ethiopia (4.460)
120. Sri Lanka (4.440)
121. Armenia (4.376)
122. India (4.315)
123. Mauritania (4.292)
124. Congo (Brazzaville) (4.291)
125. Georgia (4.286)
126. Congo (Kinshasa) (4.280)
127. Mali (4.190)
128. Ivory Coast (4.180)
129. Cambodia (4.168)
130. Sudan (4.139)
131. Ghana (4.120)
132. Ukraine (4.096)
133. Uganda (4.081)
134. Burkina Faso (4.032)
135. Niger (4.028)
136. Malawi (3.970)
137. Chad (3.936)
138. Zimbabwe (3.875)
139. Lesotho (3.808)
140. Angola (3.795)
141. Afghanistan (3.794)
142. Botswana (3.766)
143. Benin (3.657)
144. Madagascar (3.644)
145. Haiti (3.603)
146. Yemen (3.593)
147. South Sudan (3.591)
148. Liberia (3.533)
149. Guinea (3.507)
150. Togo (3.495)
151. Rwanda (3.471)
152. Syria (3.462)
153. Tanzania (3.349)
154. Burundi (2.905)
155. Central African Republic (2.693)
Average life evaluations in the top 10 countries are more than twice as high as in the bottom 10.
The 4 point difference, 3.25 points can be traced to differences in the six key factors: 1.15 points from the GDP per capita gap, 0.86 due to differences in social support, 0.57 to differences in healthy life expectancy, 0.33 to differences in freedom, 0.2 to differences in corruption, and 0.13 to differences in generosity. Income differences are more than one-third of the total explanation because, of the six factors, income is the most unequally distributed among countries. GDP per capita is 25 times higher in the top 10 than in the bottom 10 countries.
Data: worldhappiness.report
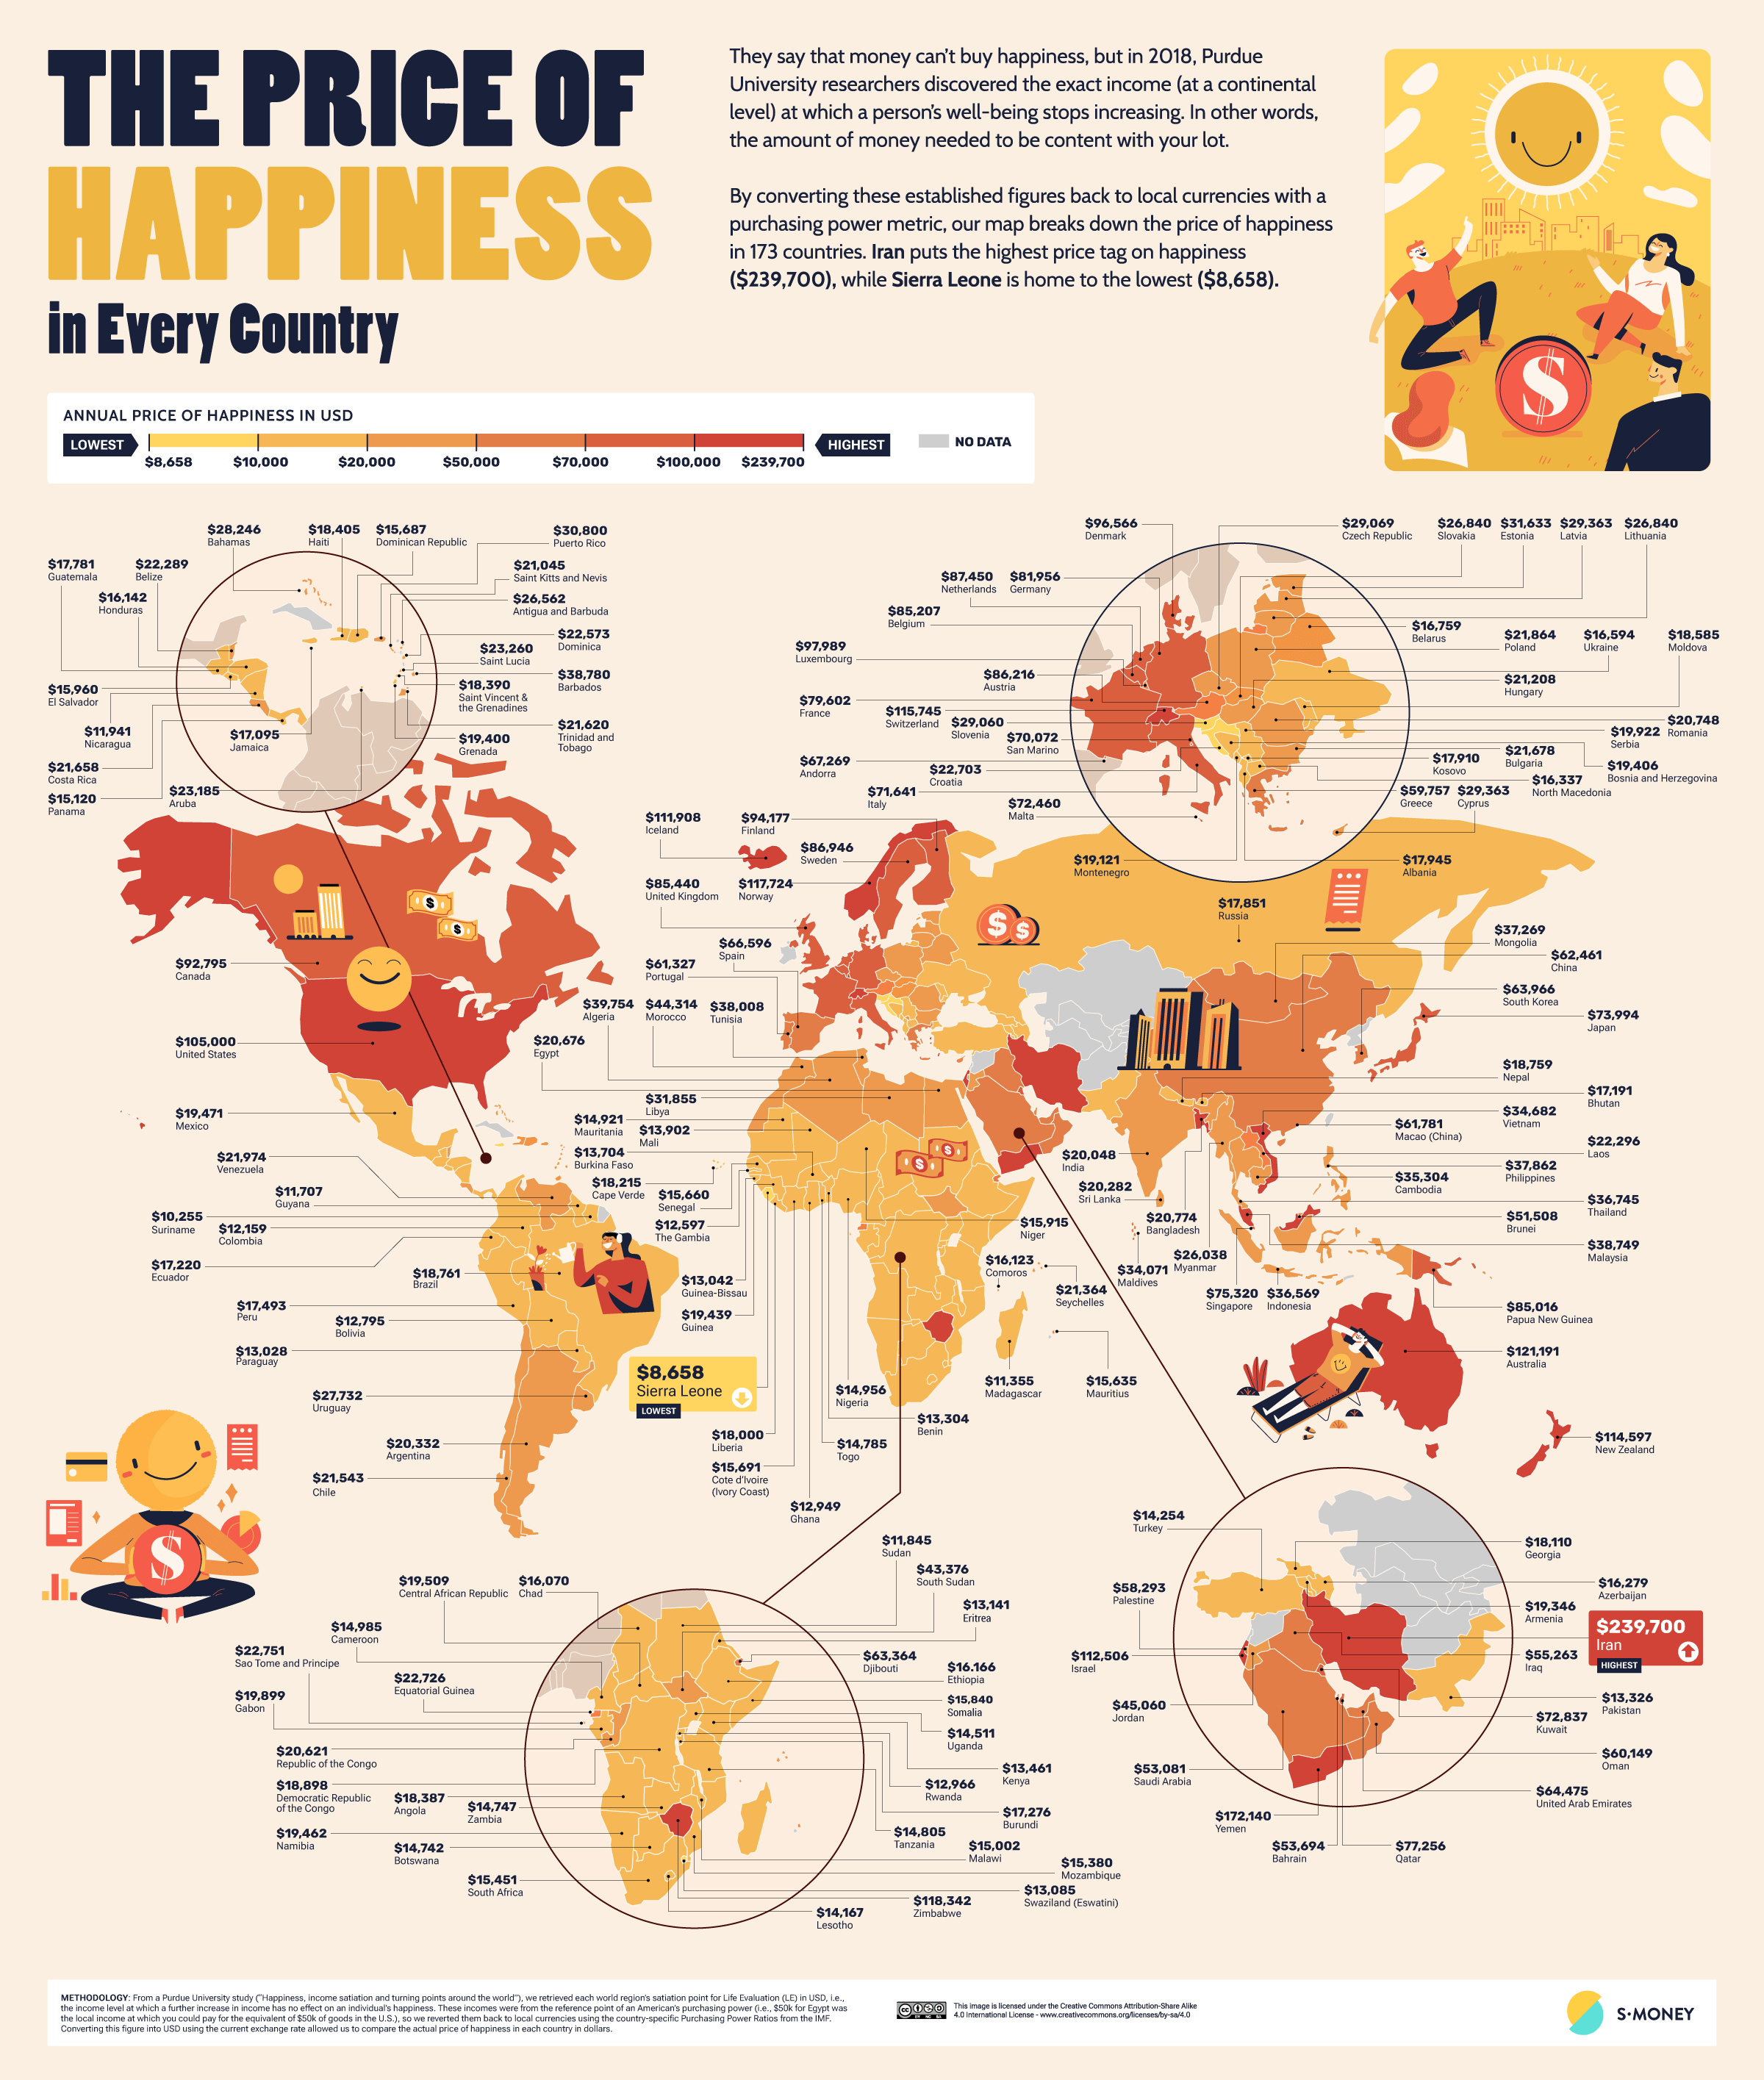
Happiness loses its linearity after some point. This is called the Easterlin paradox, after the classic study from 1974. The paradox states, that after a certain point the different values of GDP don’t have an impact on happiness levels, and therefore the variance in happiness levels between wealthy “developed” countries has to be explained by different factors.

Related posts:
– The Happy Planet Index (2016)
– Global happiness & sadness (2015)
– Self-reported Life Satisfaction (2005 – 2015)




Some definite spatial association between this data and the core, periphery, and semi-periphery…