Hurricane Matthew’s water footprint
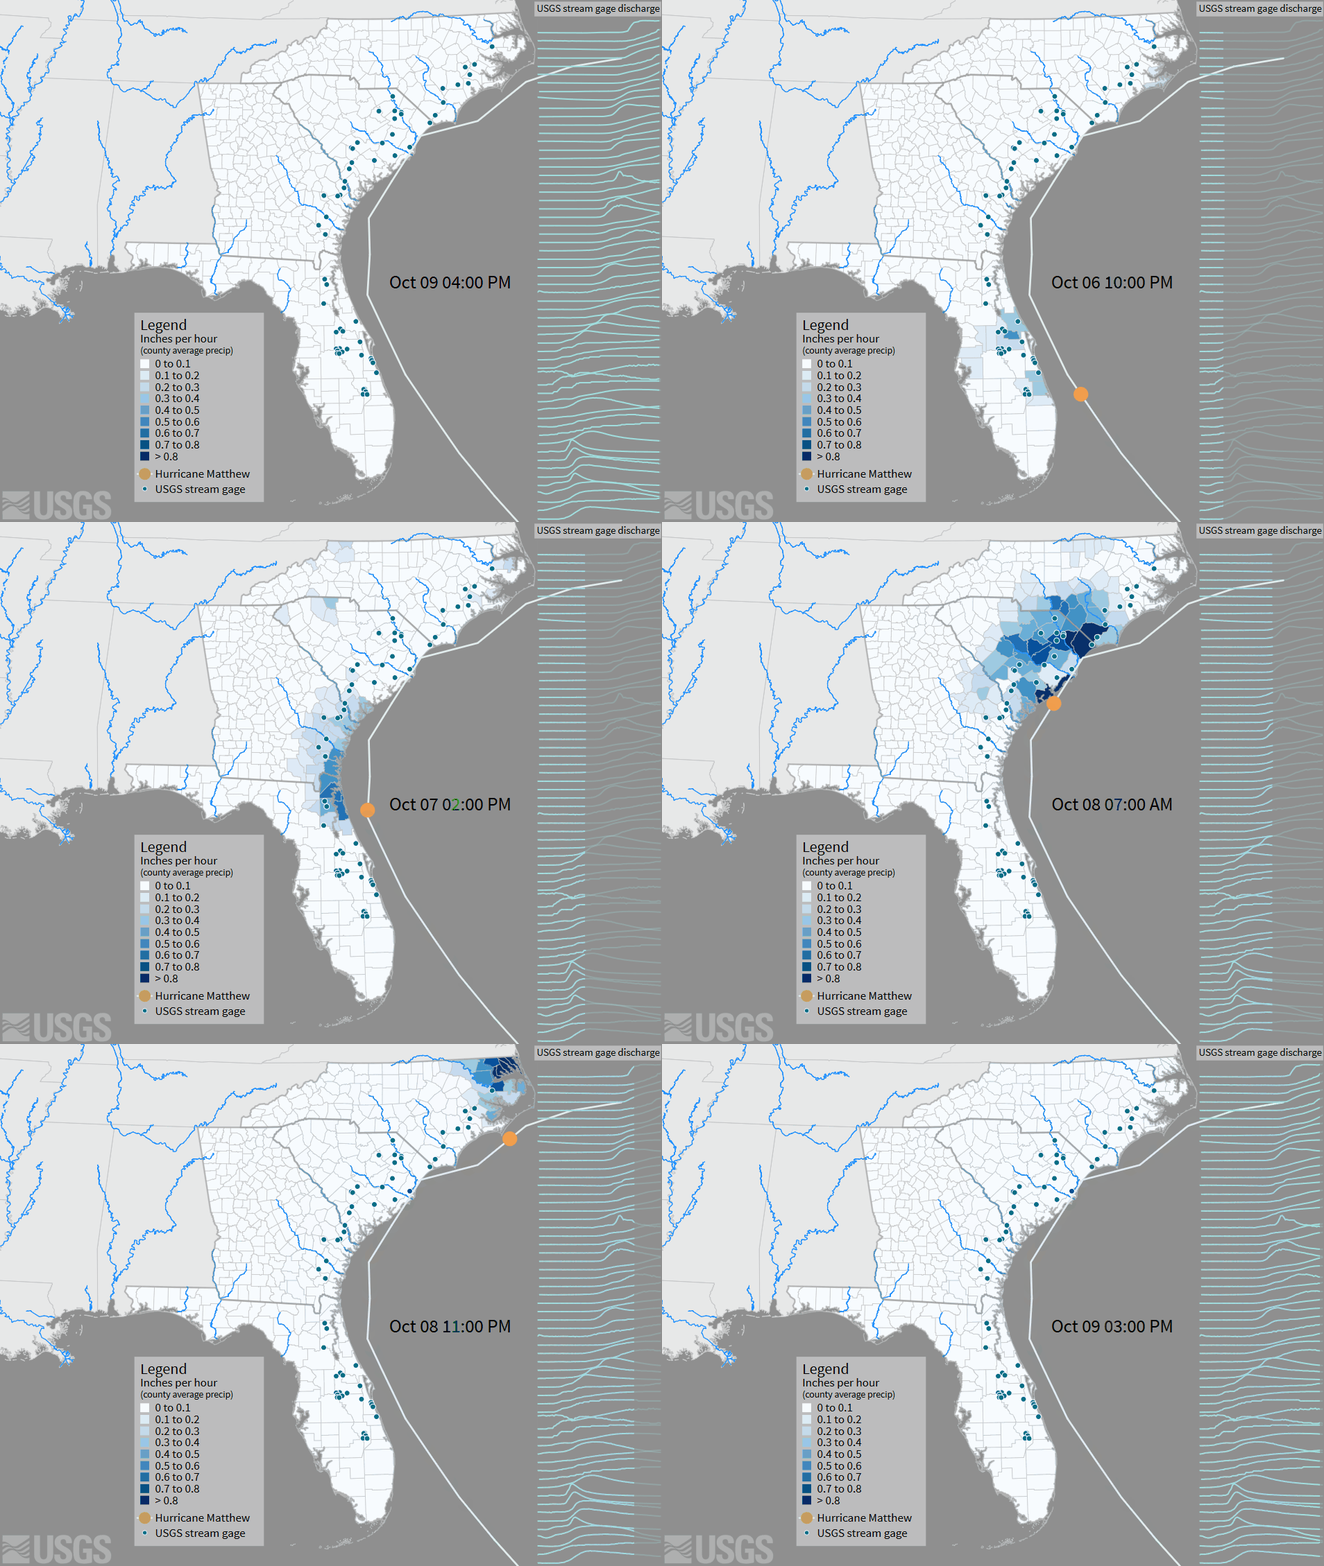
Hurricane Matthew approached the southeastern United States coast on October 7, 2016. In the map above, the hurricane’s impact on precipitation and streamflow are shown. Normalized discharge (cubic feet per second) at US Geological Survey gaging stations within ~150 km of the eye of the hurricane is shown in the right panel. Variation in the shape of the hydrographs (right panel) is due to stream size, storm-surge, reservoir closures, and other local conditions, which can impact the effect of precipitation on flow.
Via owi.usgs.gov
Related post:
– Hurricane Matthew’s outer bands approaching the Florida coast (October 6)


