Income needed for household economic security in every U.S. state
The income required for household economic security in the United States is a multifaceted concept that depends on a range of factors, including geographical location, family size, and individual lifestyle preferences. Essentially, economic security signifies having sufficient financial resources to cover fundamental necessities such as housing, food, healthcare, education, transportation, and the capacity to save for unforeseen emergencies and retirement, all without enduring perpetual financial strain.
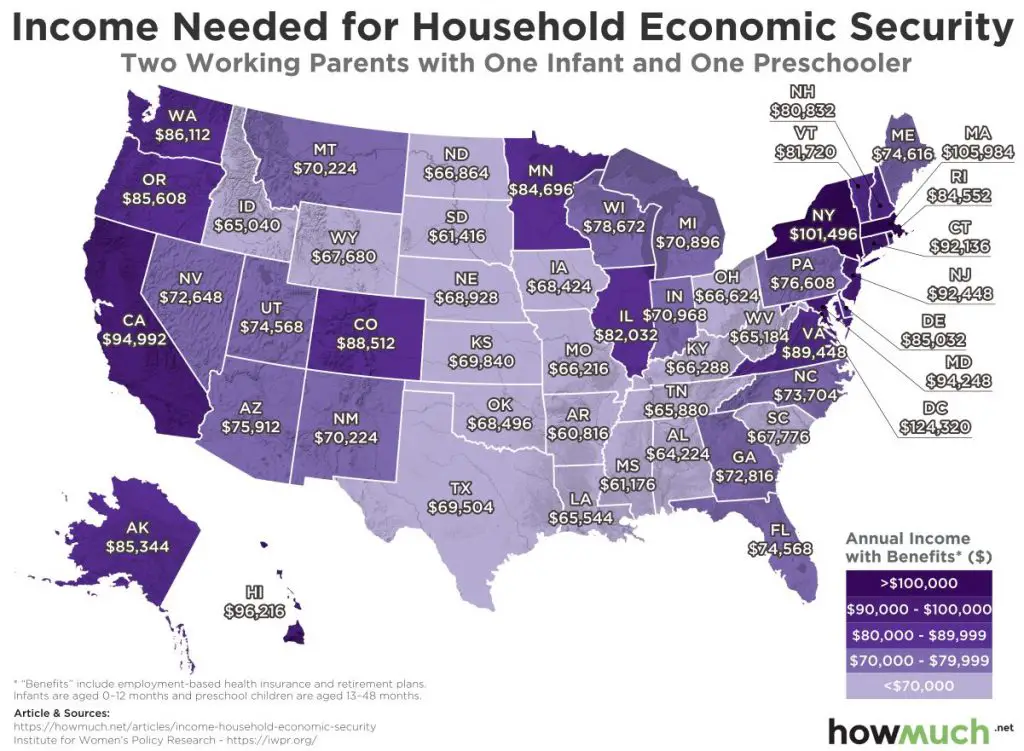
Maps below created by howmuch.net using iwpr.org data show the minimum income required for economic security in each state.

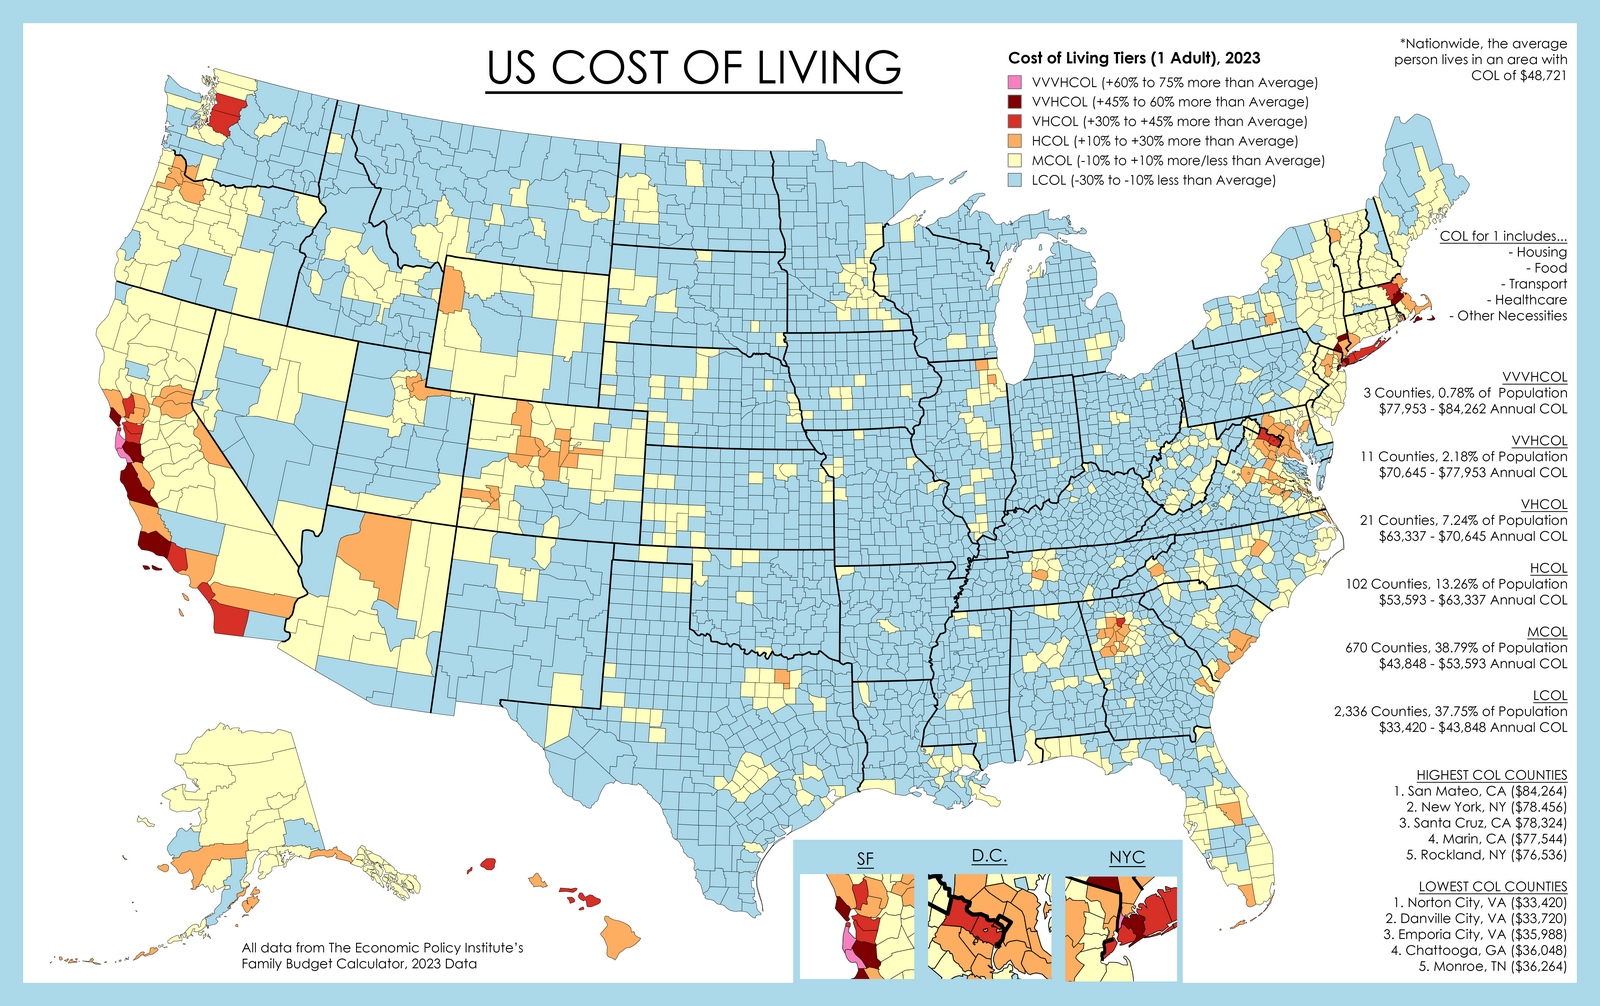
The United States exhibits substantial disparities in the cost of living across regions. Major urban centers like New York City and San Francisco typically entail significantly higher expenses compared to rural areas in the Midwest. Housing costs, in particular, can exert substantial pressure on household budgets and, consequently, influence the income needed for economic security. Family size is another pivotal determinant, with larger families generally requiring higher incomes to satisfy basic requirements. Childcare, education, and healthcare expenses can notably increase the financial obligations of larger households.

Amount of annual income working adults with employment benefits need for basic economic security in the U.S.
- a single working adult: $33,012 per year ($2,751 per month,)
- a single parent with 1 infant: $50,916 per year ($4,243 per month,)
- two working adults with 1 infant, 1 preschooler: $79,224 per year ($6,602 per couple per month,)
| State | % with Economic Security | Single working adult with Benefits | Single working parent with one infant with Benefits | Two working parents with one infant and one preschooler with benefits |
|---|---|---|---|---|
| NEW HAMPSHIRE | 78 | 32.892 | 52.2 | 80.832 |
| OHIO | 76 | 26.052 | 40.848 | 66.624 |
| IOWA | 75 | 26.436 | 41.424 | 68.424 |
| SOUTH DAKOTA | 75 | 24.648 | 37.14 | 61.416 |
| CONNECTICUT | 74 | 36.936 | 60.168 | 92.136 |
| NORTH DAKOTA | 74 | 27.144 | 41.232 | 66.864 |
| PENNSYLVANIA | 74 | 30.408 | 47.856 | 76.608 |
| WYOMING | 74 | 26.676 | 40.752 | 67.68 |
| ALASKA | 73 | 34.536 | 55.728 | 85.344 |
| NEBRASKA | 73 | 26.472 | 42.672 | 68.928 |
| WISCONSIN | 73 | 28.368 | 48.588 | 78.672 |
| KANSAS | 72 | 26.352 | 41.292 | 69.84 |
| MINNESOTA | 72 | 30.588 | 50.028 | 84.696 |
| MISSOURI | 72 | 27.204 | 39.54 | 66.216 |
| RHODE ISLAND | 72 | 32.868 | 53.748 | 84.552 |
| INDIANA | 71 | 27.204 | 41.52 | 70.968 |
| MICHIGAN | 71 | 28.752 | 44.28 | 70.896 |
| TENNESSEE | 71 | 26.892 | 40.5 | 65.88 |
| ILLINOIS | 70 | 32.688 | 51.276 | 82.032 |
| KENTUCKY | 70 | 27.396 | 41.052 | 66.288 |
| MAINE | 70 | 31.284 | 48.372 | 74.616 |
| MASSACHUSETTS | 70 | 41.34 | 66.312 | 105.984 |
| NEW JERSEY | 70 | 40.296 | 61.356 | 92.448 |
| WEST VIRGINIA | 70 | 27.024 | 39.948 | 65.184 |
| DISTRICT OF COLUMBIA | 69 | 50.508 | 81.588 | 124.32 |
| MARYLAND | 69 | 43.272 | 66.264 | 94.248 |
| NEVADA | 69 | 27.36 | 46.08 | 72.648 |
| ARKANSAS | 68 | 26.112 | 37.128 | 60.816 |
| VERMONT | 68 | 33.528 | 52.392 | 81.72 |
| WASHINGTON | 68 | 35.316 | 56.04 | 86.112 |
| ALABAMA | 67 | 29.58 | 41.088 | 64.224 |
| COLORADO | 67 | 34.152 | 56.124 | 88.512 |
| LOUISIANA | 67 | 29.472 | 41.544 | 65.544 |
| NORTH CAROLINA | 67 | 29.976 | 46.164 | 73.704 |
| OKLAHOMA | 67 | 27.48 | 43.368 | 68.496 |
| TEXAS | 67 | 29.172 | 44.652 | 69.504 |
| VIRGINIA | 67 | 39.384 | 58.92 | 89.448 |
| UNITED STATES | 67 | 33.012 | 50.916 | 79.224 |
| IDAHO | 66 | 26.22 | 40.26 | 65.04 |
| MONTANA | 66 | 27.648 | 43.488 | 70.224 |
| SOUTH CAROLINA | 66 | 29.784 | 42.624 | 67.776 |
| UTAH | 66 | 28.104 | 47.496 | 74.568 |
| ARIZONA | 65 | 30.12 | 47.196 | 75.912 |
| DELAWARE | 65 | 35.124 | 54.228 | 85.032 |
| MISSISSIPPI | 65 | 27.948 | 37.932 | 61.176 |
| NEW MEXICO | 65 | 27.228 | 43.644 | 70.224 |
| GEORGIA | 64 | 32.544 | 47.148 | 72.816 |
| FLORIDA | 62 | 31.668 | 50.112 | 74.568 |
| HAWAII | 61 | 45.456 | 66.588 | 96.216 |
| OREGON | 61 | 34.2 | 53.4 | 85.608 |
| NEW YORK | 59 | 44.088 | 66.972 | 101.496 |
| CALIFORNIA | 58 | 42.06 | 64.62 | 94.992 |
Key facts
- Only 67% of working adults (aged 19–64)in the U.S. are economically secure, meaning their family household income is enough to meet monthly basic expenses and reach modest asset development goals.
- Working men are more likely to be economically secure than working women (68.2% of
men are economically secure, compared with 65.5% of women). - White men are the most likely to live with economic security in the U.S., and Hispanic men and women are least likely to live with economic security.
- Just under one in four households headed by single mothers in the U.S. are economically secure and live with family incomes above the BEST Index for their family type. Families headed by single mothers are the least likely to be economically secure, while married couples without children are the most likely to be economically secure.


Various correlations come to mind!