Lynching is an extrajudicial murder by a group. In the U.S., where the word for “lynching” likely formed, lynchings of African Americans became systematic in the South before and after the American Civil War.
From 1883 to 1941, there were 4,467 sufferers of lynching. Of these, 4,027 were male, 99 female, and 341 were of unknown gender. Regarding ethnicity, 3,265 were black, 1,082 were white, 71 were Mexican or of Mexican origin, 38 were American Indian, 10 were Chinese, and 1 was Japanese. At the first documented lynching in St. Louis in 1835, a Black man named McIntosh who murdered a deputy sheriff while being taken to prison was arrested, tied to a tree, and burned to death on an intersection lot downtown in front of a gathering of over one thousand people.
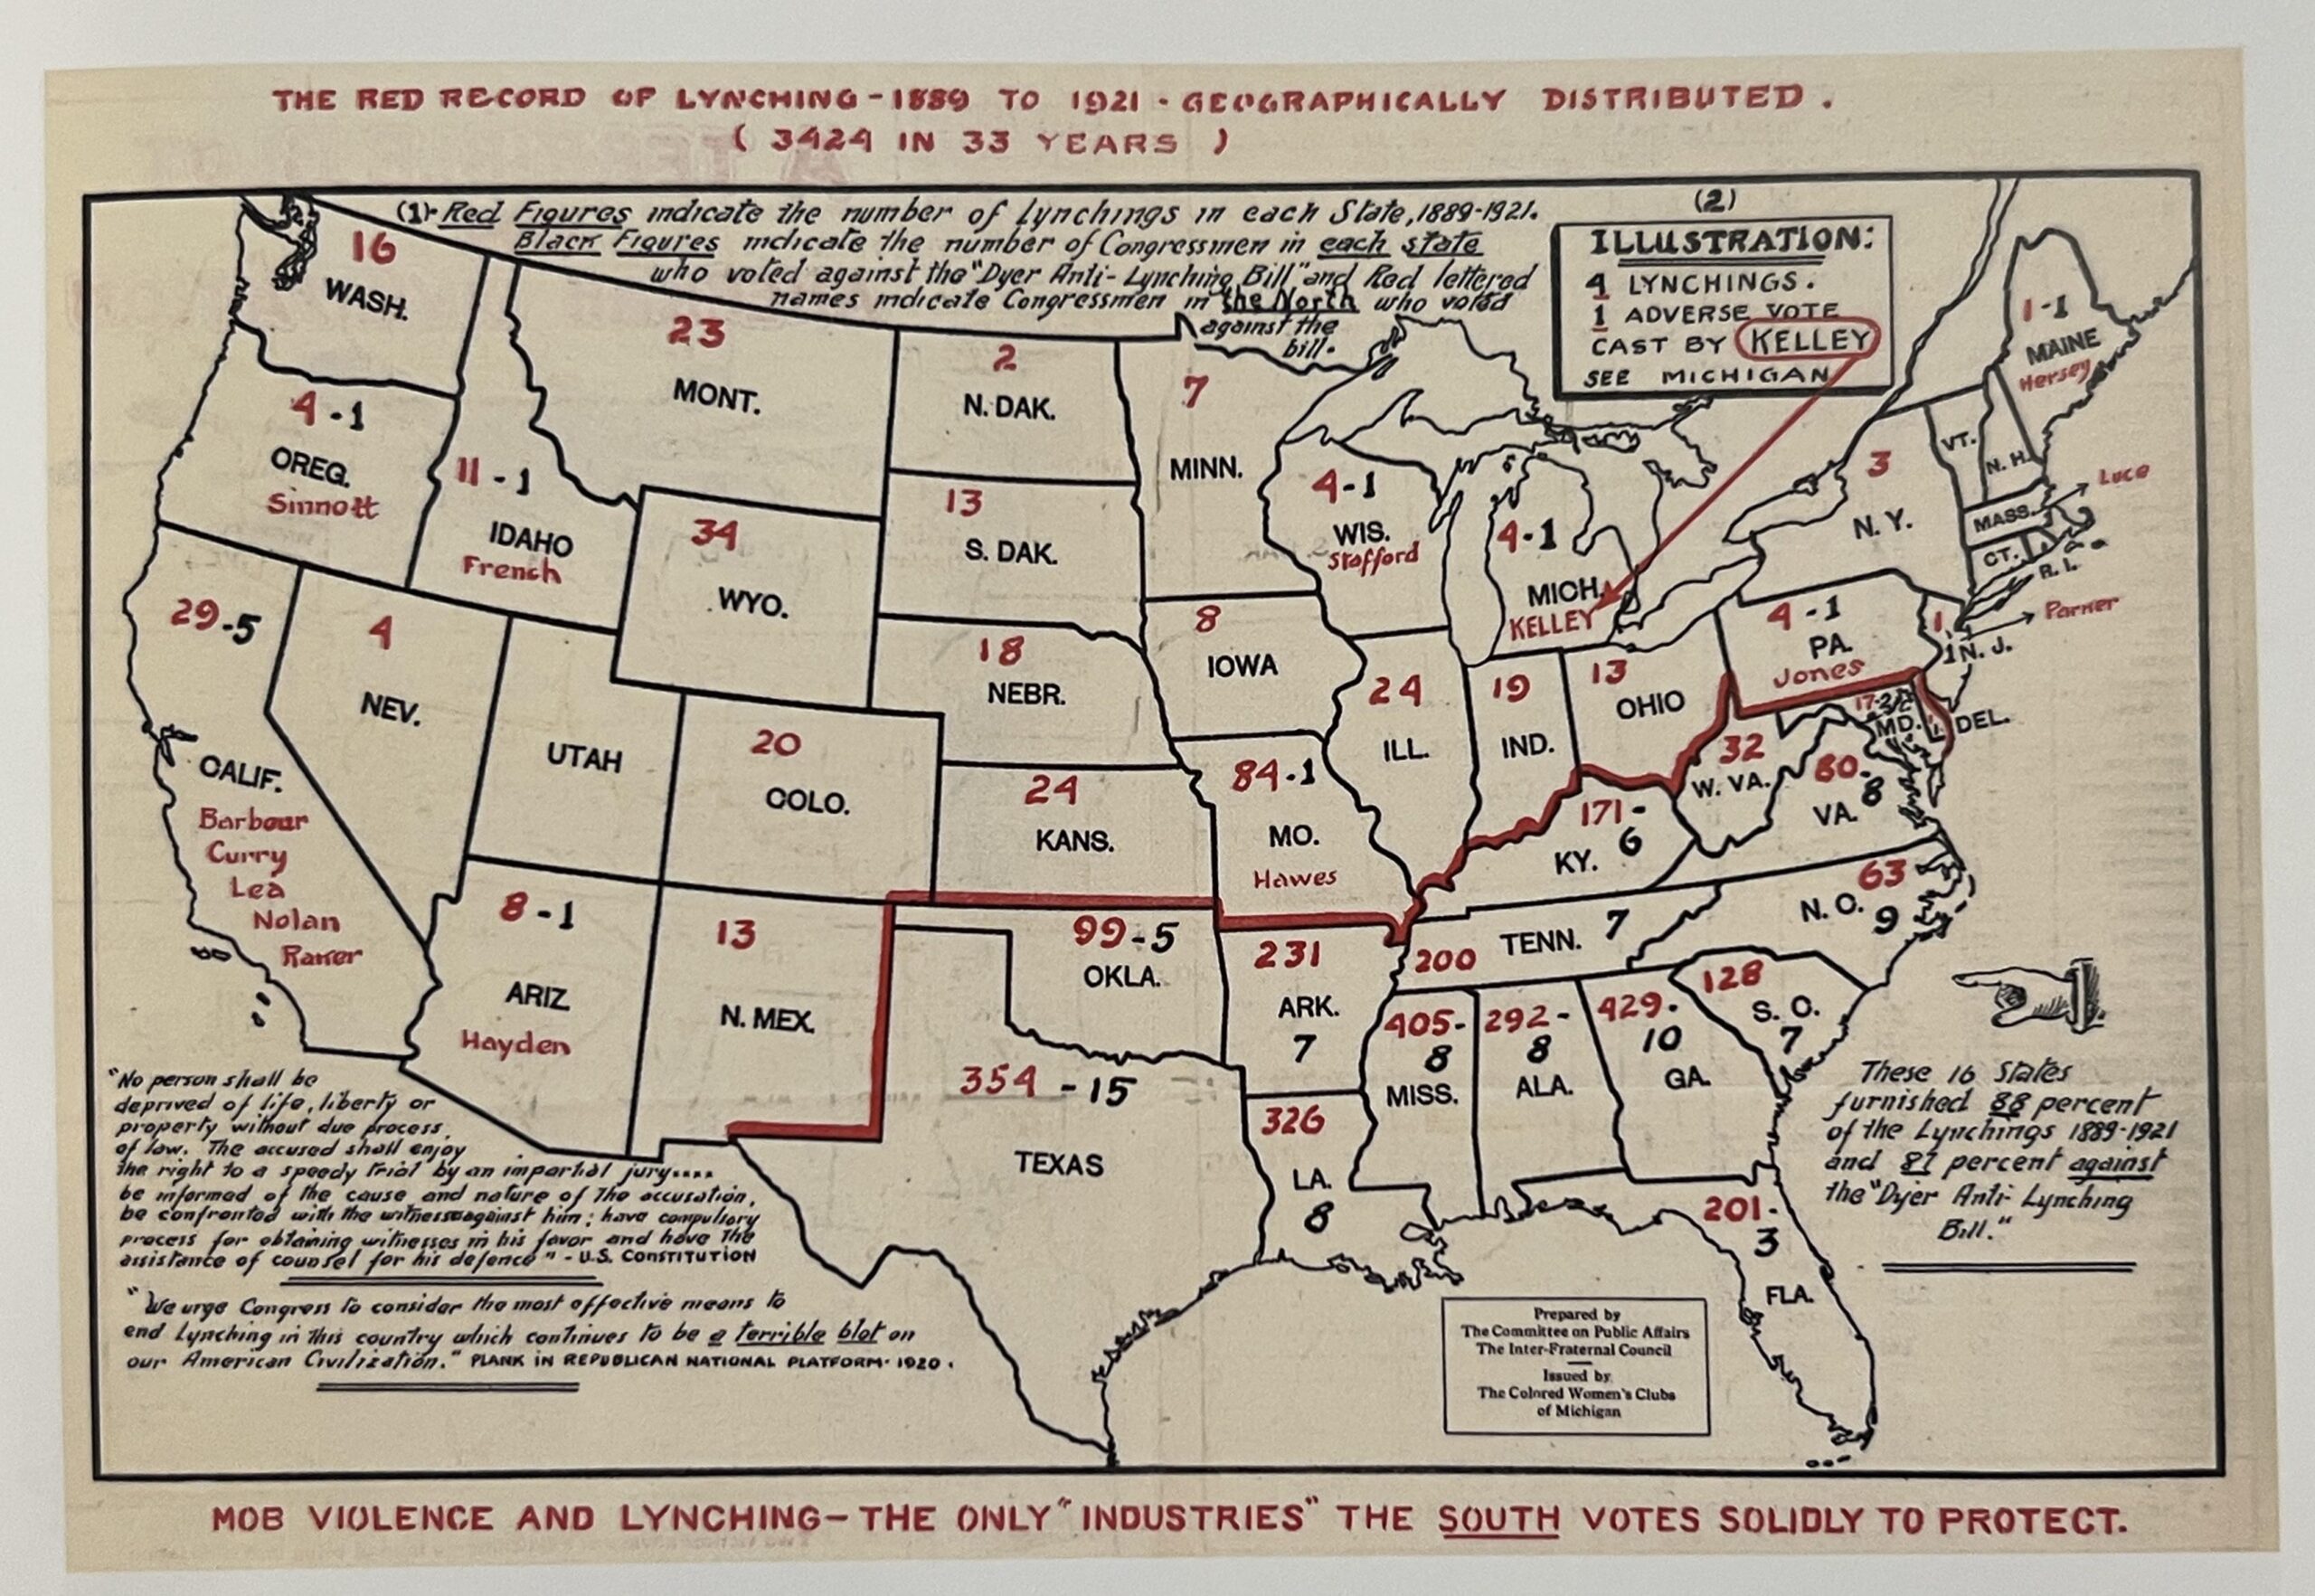
The Dyer Anti-Lynching Bill was first presented to the U.S. Congress in 1918 by Republican congressional representative Leonidas Dyer of St. Louis (Missouri). The U.S. House of Representatives passed the bill in 1922, and the same year, it was given a positive report by the U.S. Senate Committee. Its acceptance was blocked by White Democratic senators from the Southern bloc, the only representatives elected since the southern U.S. states had delegitimized Black Americans at the beginning of the 20th century. The Dyer Anti-Lynching Bill affected later anti-lynching legislation, including the Costigan-Wagner Bill, which was also knocked out in the U.S. Senate.
One hundred years ago, people were unwilling or afraid to vote against lynching. Below is a 1921 map of Lynchings in the United States and the votes against an anti-lynching bill.
Here are a few more animated maps shedding light on lynching in America.
Racial Terror Lynching
Racial terror lynchings were not limited to the South, but these twenty states had the most in the nation: over 4,000 between 1877 and 1950.
On average, mobs killed 9 people per month during the 1890s. The average was 7 people per month over the next 20 years. Below is another animated map of the lynchings and riots to enforce racial superiority in the United States.
The great migration
Over six million African Americans fled the South in the first half of the 20th century. Terror lynchings and other racial violence played a key role in this forced migration of black Americans to the North and West. Many fled in fear for their lives.
What a strange map, why would they leave off the other states that had data and why that specific range of dates? Would seem that something specific is trying to be voiced by manipulating the data, but I give the benefit of the doubt that maybe that those are the only years with records and the other states had so few as to be negligible.
Chaplin
8 years ago
Plenty of those lynchings were of Whites. It was an uncommon extrajudicial punishment encouraged by lax justice from politically motivated courts. Like today. Still, I had no idea the numbers were so low. 4,000 deaths in three quarters of a century in a country that big? That’s the bodycount for a few months in the “inner cities” post-Ferguson. At least it explains the obsession for Emmett Till and all the movies, documentaries and media references – the pool of available martyrs was low.


What a strange map, why would they leave off the other states that had data and why that specific range of dates? Would seem that something specific is trying to be voiced by manipulating the data, but I give the benefit of the doubt that maybe that those are the only years with records and the other states had so few as to be negligible.
Plenty of those lynchings were of Whites. It was an uncommon extrajudicial punishment encouraged by lax justice from politically motivated courts. Like today. Still, I had no idea the numbers were so low. 4,000 deaths in three quarters of a century in a country that big? That’s the bodycount for a few months in the “inner cities” post-Ferguson. At least it explains the obsession for Emmett Till and all the movies, documentaries and media references – the pool of available martyrs was low.
let’s retire the race bait shit til the cloud has passed over..aye? getting real old