Mapping Traffic Fatalities on America’s Roads
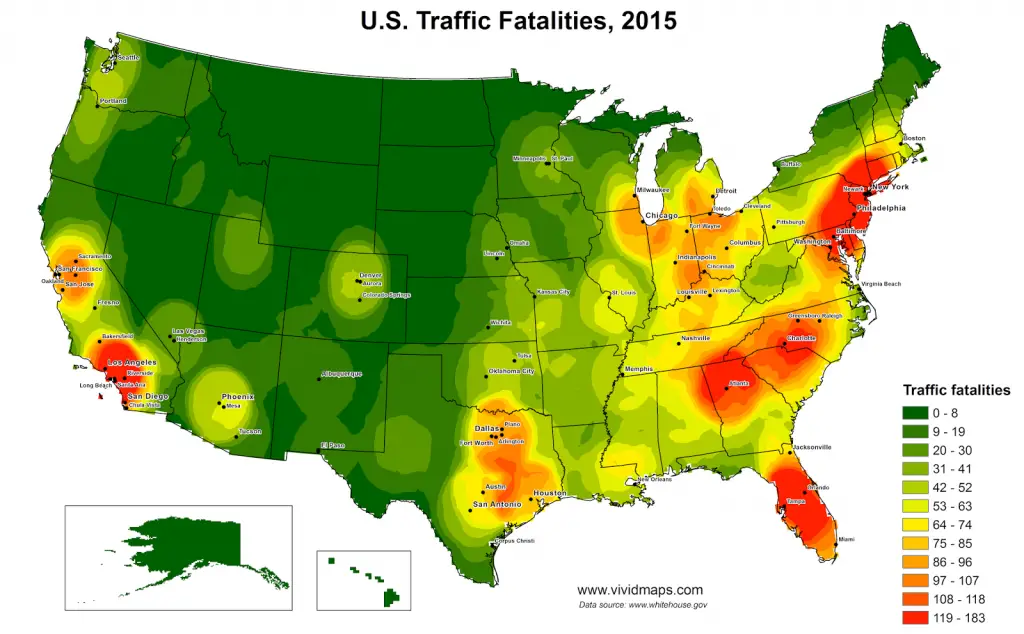
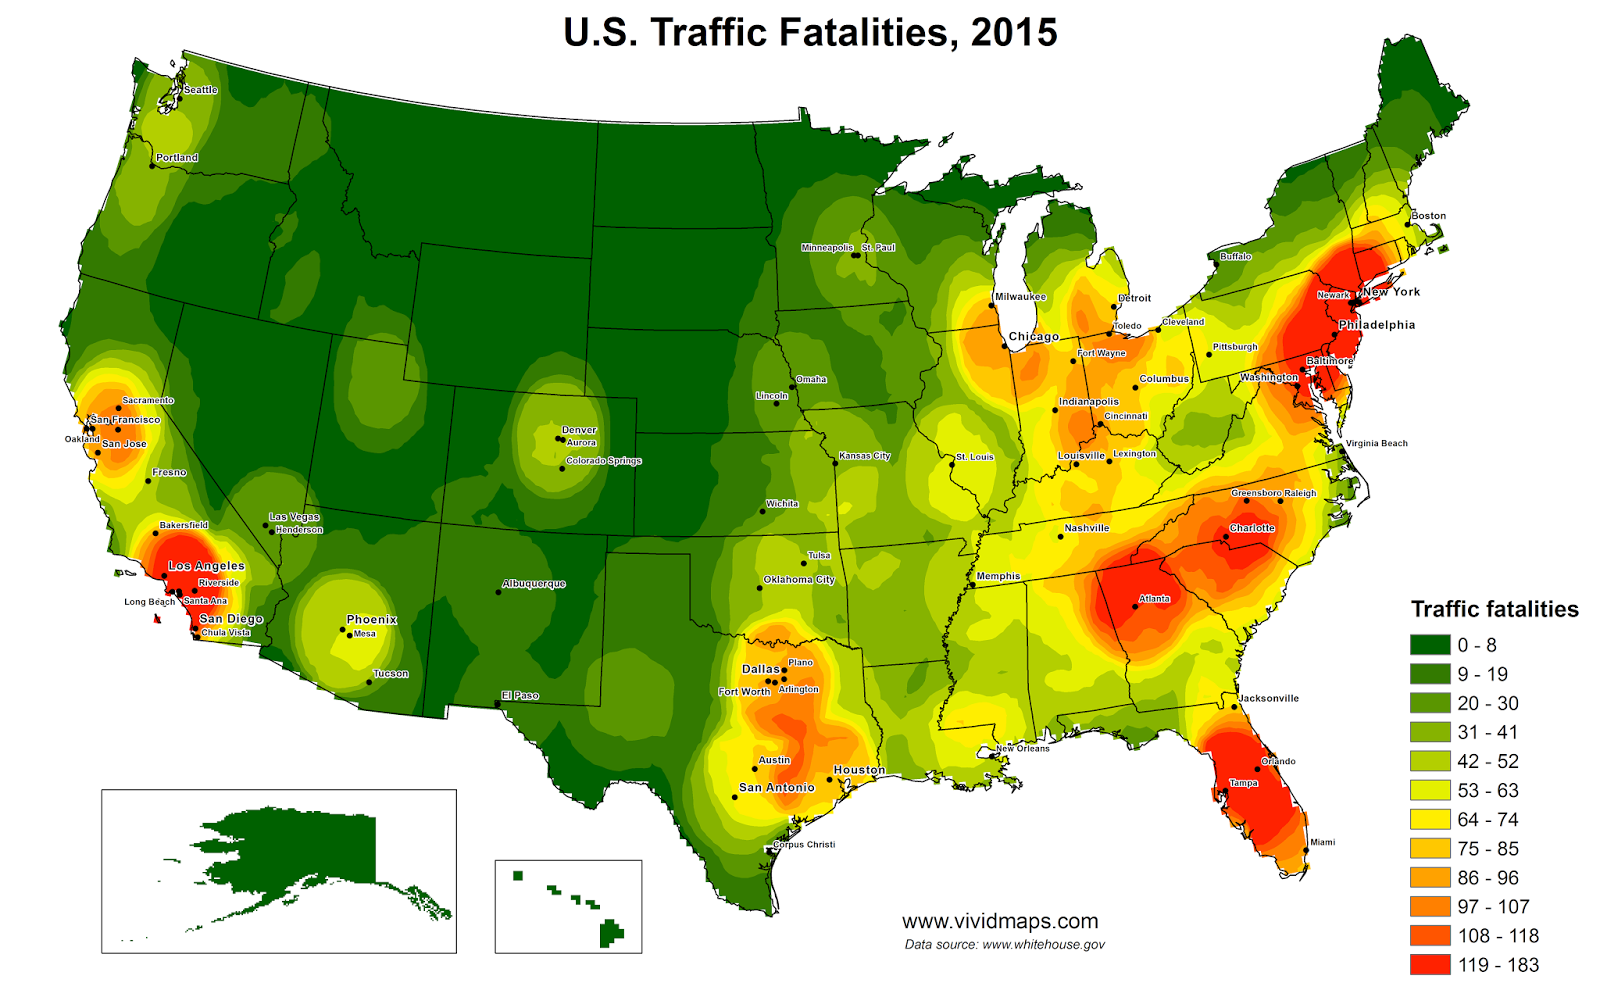
The number of traffic fatalities in the U.S. increased over 7% in 2015 relative to the previous year, the largest such increase in almost half a century. Despite the recent uptick, traffic fatalities have been steadily decreasing for the past several decades. Deadly traffic accidents have dropped 29% since 1980.
South Carolina ranks worst in terms of fatal accidents per vehicle mile traveled, with 1.76 accidents per 100 million miles compared to an average of 1.04 nationwide.
Via thedataface.com
U.S. Traffic Fatalities Heat Map


