U.S. Population Change by County Mapped
America’s heartland not only feeds metropolitan centers with agricultural products and natural resources but with its people as well.
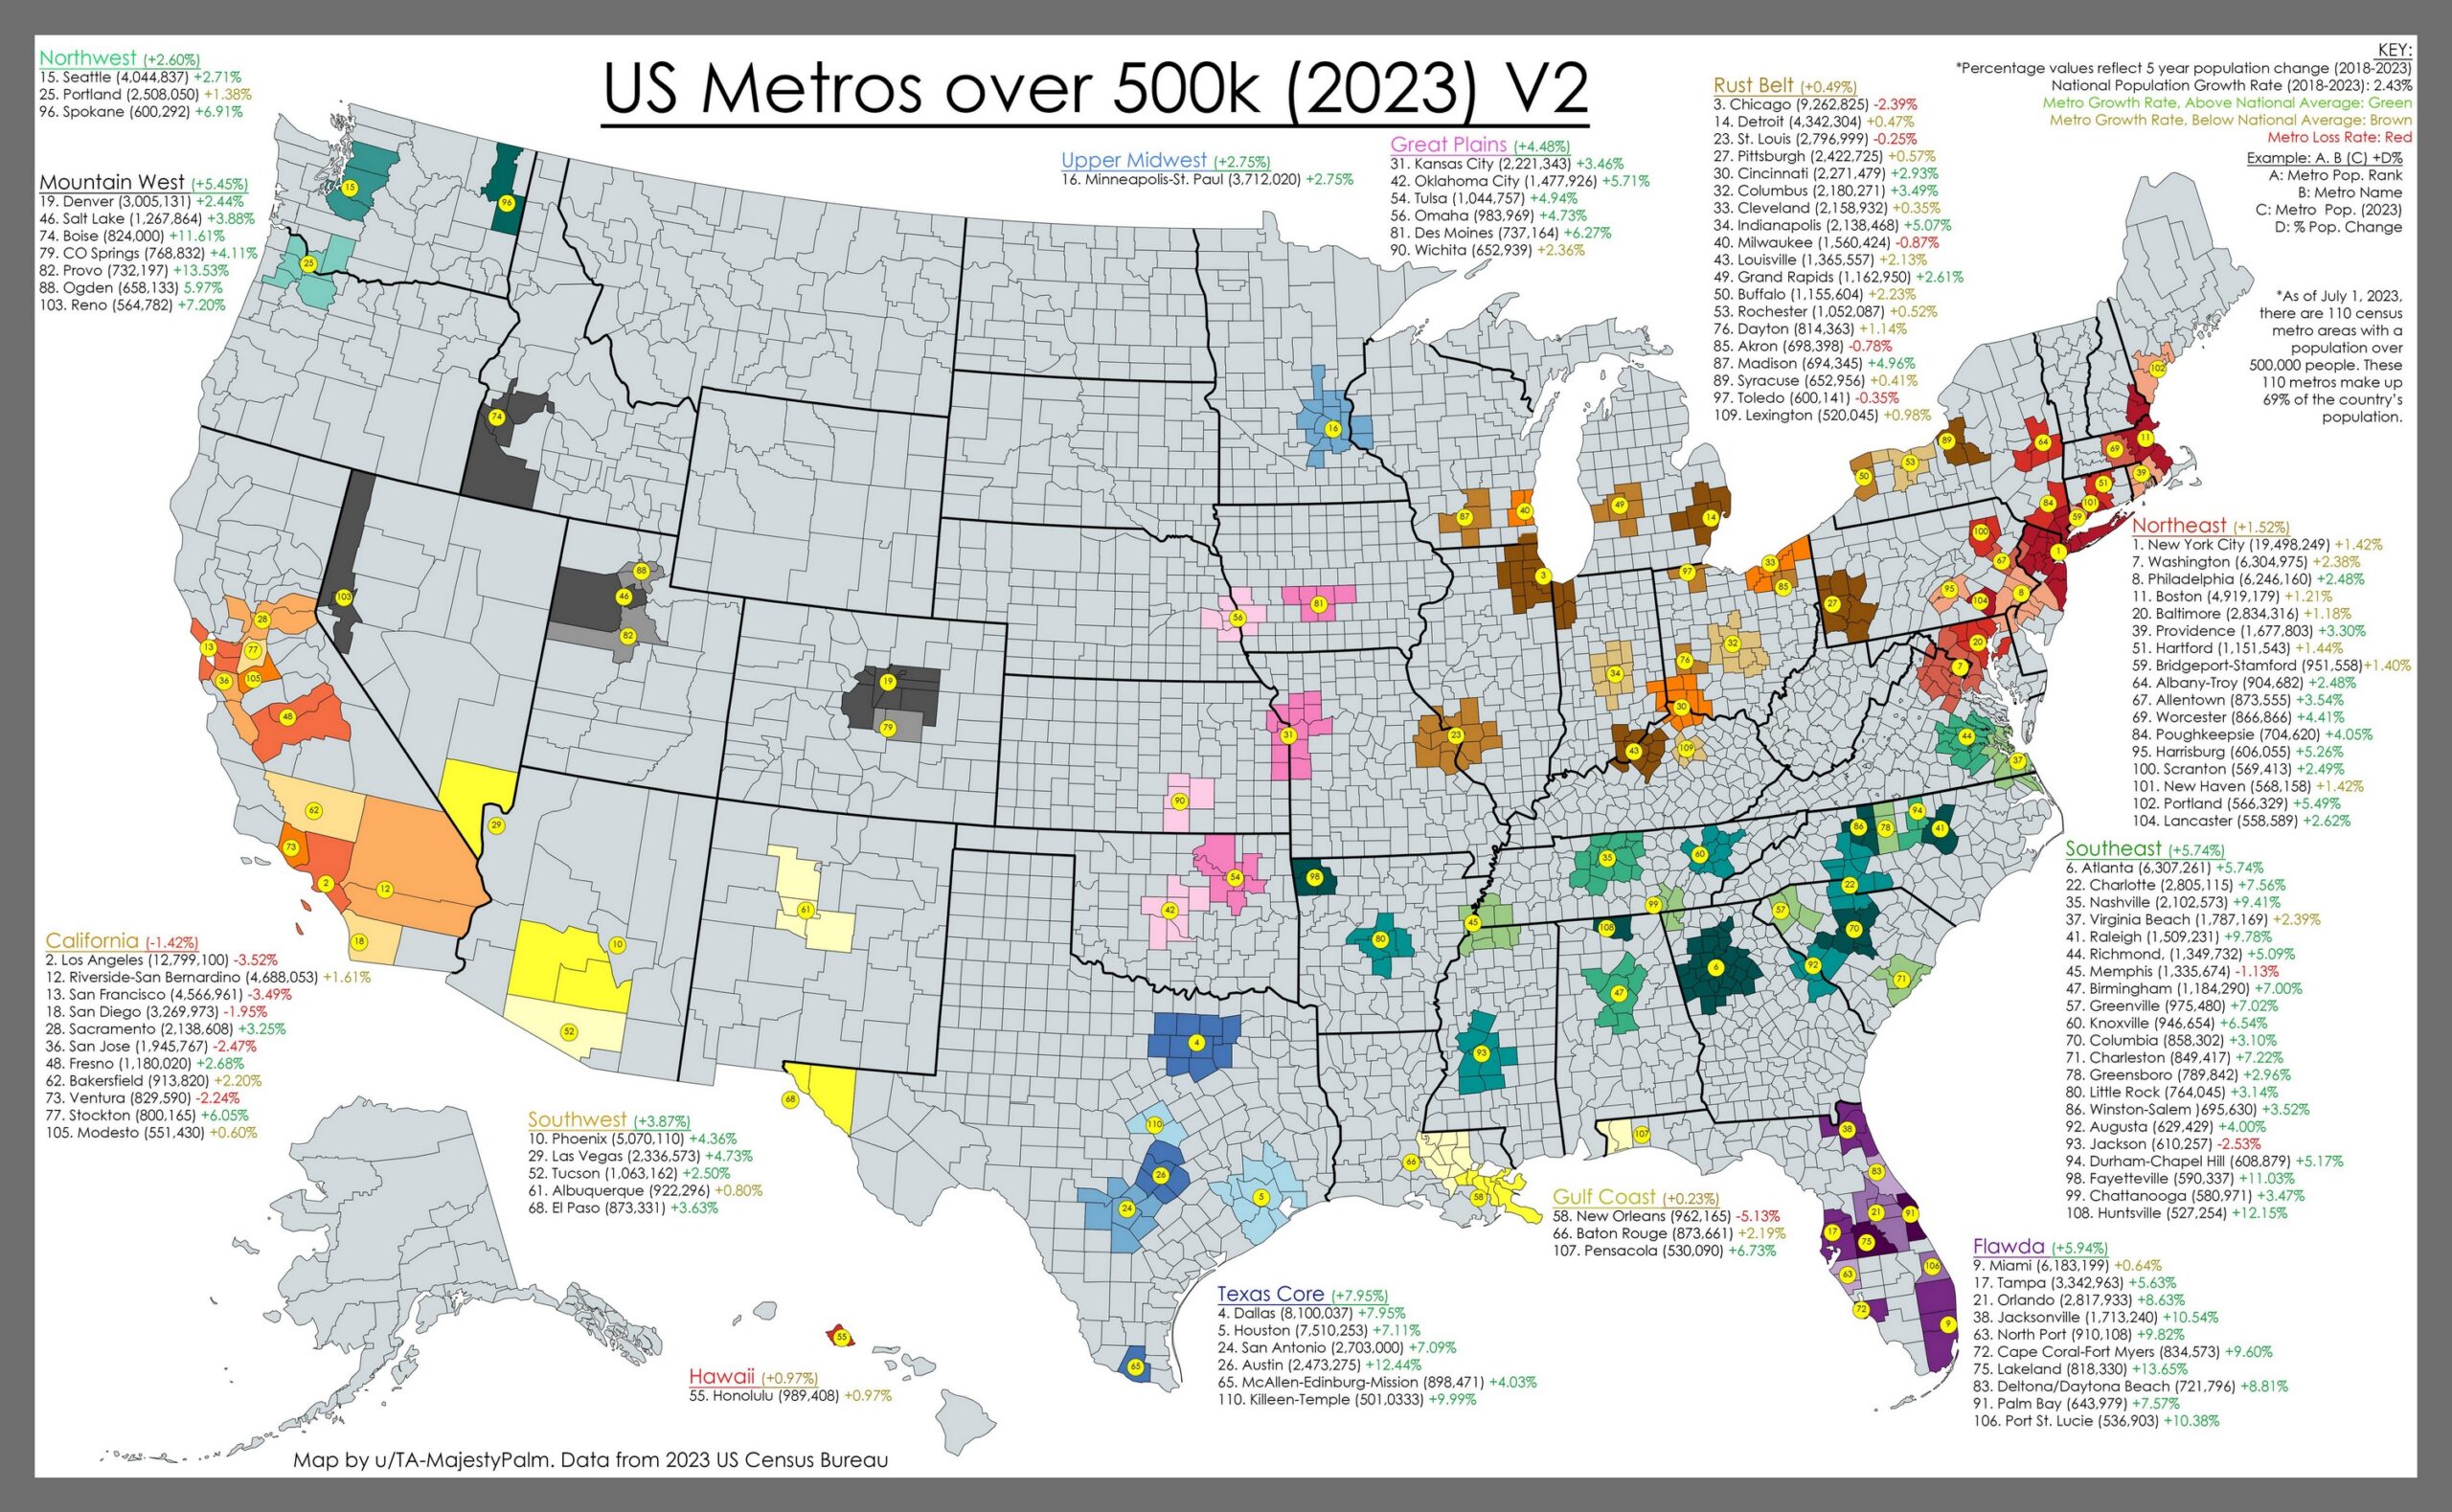
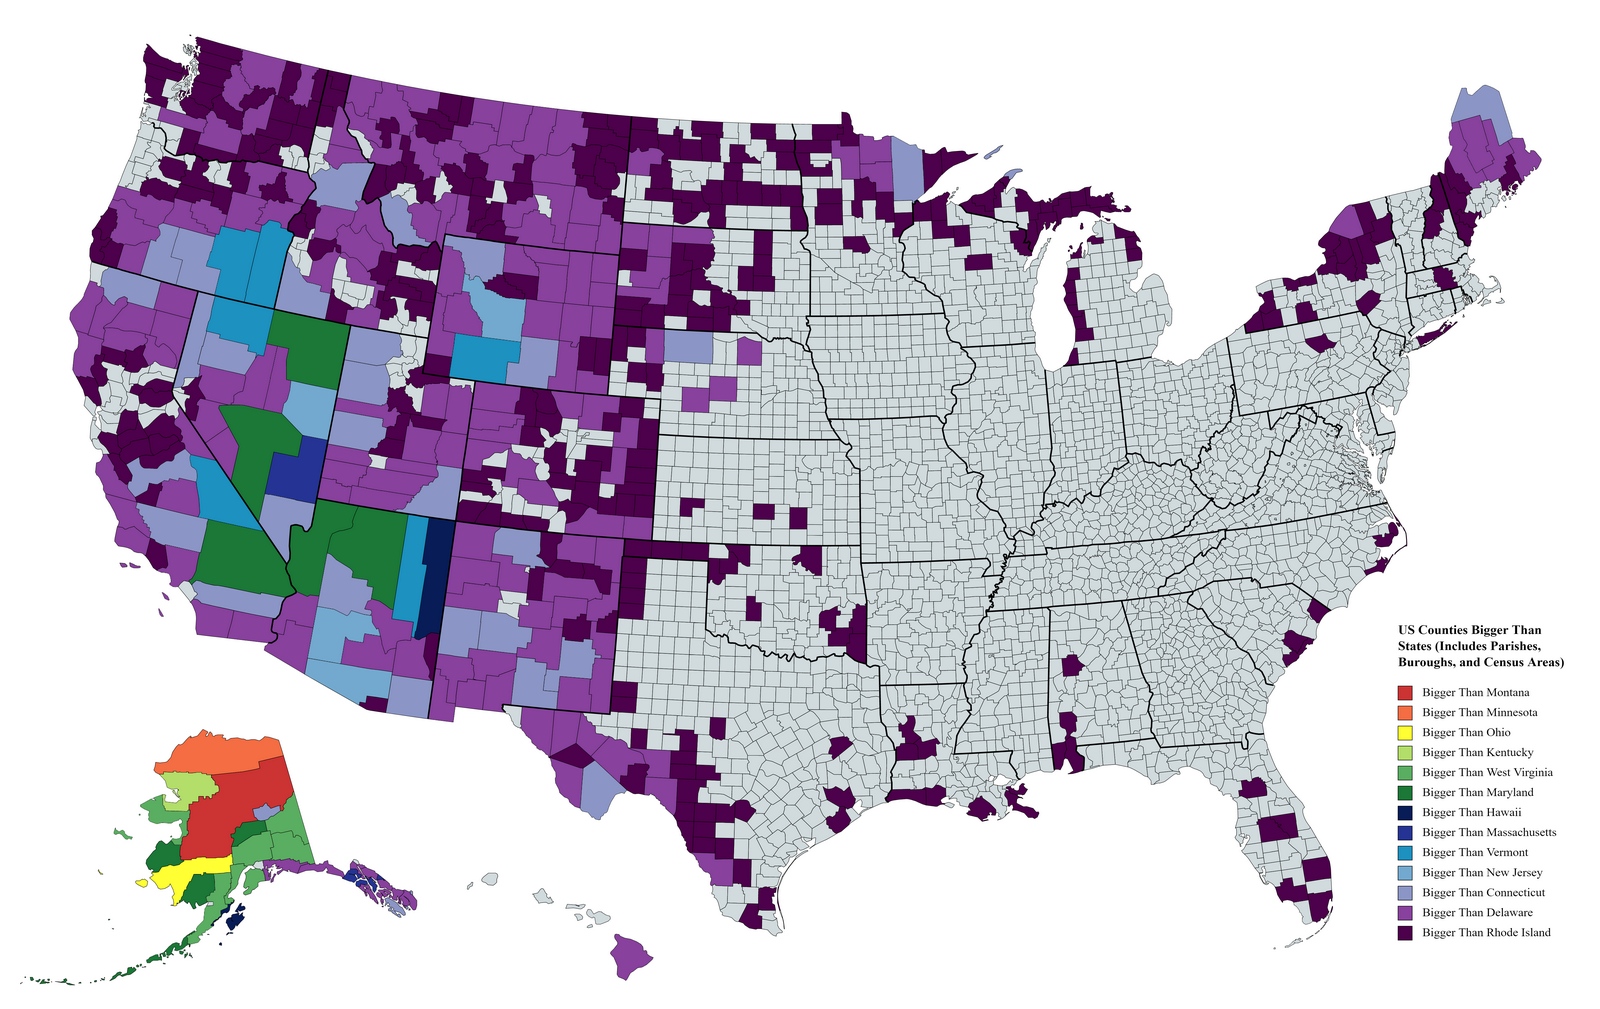
Across the country, seaside metropolitan centers are adding new residents, while rural counties are seeing their populations decrease.
Here is the map of U.S. population change by county from 2000 to 2020 created using data from the U.S. Census Bureau.

From 2000 to 2020, the total U.S. population rose 18%, from 281,421,906 to 331,449,281.
There are 3,142 U.S. counties counted as part of this map. Of these, 1,781 experienced positive growth, while 1,361 witnessed a decrease.
Which U.S. Counties are Growing the Fastest?
The U.S. economy has risen for over a decade, but that gain increasingly concentrates in 1% of American counties.
According to Bureau of Economic Analysis data, 31 American counties handled 32.3% of the U.S. gross domestic product (GDP).
Changing population patterns on the map above can help us notice where economic growth occurs in the United States.
Top 10 U.S. Counties for Population Growth
At the top of the rank is Loving County, Texas, which experienced an increase of 182% in its population from 2000 to 2020.
| Rank | County | State | 2000 Population | 2020 Population | Change |
|---|---|---|---|---|---|
| 1 | Loving | Texas | 64 | 181 | +182% |
| 2 | McKenzie | North Dakota | 5,714 | 15,242 | +167% |
| 3 | Pinal | Arizona | 181,283 | 480,828 | +165% |
| 4 | Sumter | Florida | 53,554 | 139,018 | +160% |
| 5 | Lincoln | South Dakota | 24,529 | 63,019 | +157% |
| 6 | Rockwall | Texas | 43,880 | 109,888 | +150% |
| 7 | Forsyth | Georgia | 100,467 | 250,847 | +150% |
| 8 | Hays | Texas | 99,070 | 241,365 | +144% |
| 9 | Loudoun | Virginia | 173,897 | 422,784 | +143% |
| 10 | Williamson | Texas | 254,962 | 617,855 | +142% |
Which U.S. Counties are Growing the Fastest?
A stark pattern emerges if you look at a map of coal operations in the United States and compare it to the counties with the fastest declining population.
Half of the nation’s coal miners operate in just 25 U.S. counties, and as mines close, fewer economic opportunities are available in those territories.
Top 10 U.S. Counties for Population Decline
Issaquena in Mississippi that tops the rank with a 46% decline in population from 2000 to 2020.
| Rank | County | State | 2000 Population | 2020 Population | Change |
|---|---|---|---|---|---|
| 1 | Issaquena | Mississippi | 2,267 | 1,220 | -46% |
| 2 | Alexander | Illinois | 9,584 | 5,497 | -42% |
| 3 | Kalawao | Hawaii | 145 | 87 | -40% |
| 4 | McDowell | West Virginia | 27,127 | 16,916 | -38% |
| 5 | Valdez | Alaska | 10,220 | 6,437 | -37% |
| 6 | Tensas | Lousiana | 6,575 | 4,178 | -36% |
| 7 | Sharkey | Mississippi | 6,538 | 4,160 | -36% |
| 8 | Bristol Bay | Alaska | 1,230 | 788 | -36% |
| 9 | Monroe | Arkansas | 10,179 | 6,584 | -35% |
| 10 | Philips | Arkansas | 26,268 | 17,299 | -34% |


