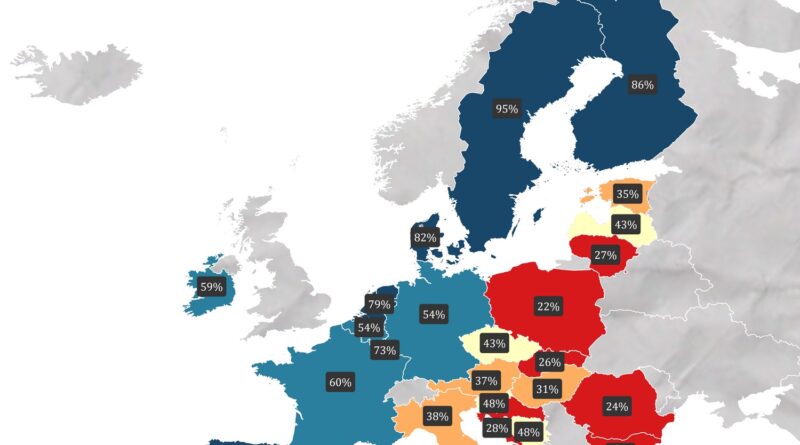
Best States for Raising a Family: A Comprehensive Analysis
Discover which states excel in providing a nurturing environment for families through our detailed examination of essential factors contributing to family well-being.
Read MoreDiscover which states excel in providing a nurturing environment for families through our detailed examination of essential factors contributing to family well-being.
Read MoreA deep dive into the financial landscape of America’s top earners, revealing the surprising income levels required to join the top 1% in different states and at various stages of life.
Read MoreWhat if election results shaped other worlds? See how Trump’s votes create Mars-like peaks and valleys, while Harris’s support carves the lunar surface – revealing Earth’s political divide through planetary terrain.
Read MoreWhat if Trump’s voting strongholds rose as mountains and Harris’s urban bases emerged as islands? These unconventional maps turn election results into physical geography, revealing dramatic shifts in American political terrain since 2020.
Read MoreThe 2024 election redrew America’s political map, with Trump winning by building surprising coalitions across rural and urban divides. These maps tell the story of an election that defied conventional wisdom.
Read MoreJourney through three decades of America’s changing demographics with animated maps that reveal where different racial and ethnic groups form county majorities, telling the story of the nation’s increasing diversity.
Read MoreDiscover the changing geographic distribution of non-Hispanic white Americans through animated maps showing county-level population patterns from 1990 to 2022, revealing fascinating demographic shifts across the United States.
Read MoreFrom battleground state dramas to surprising electoral vote shifts, explore how the 2024 election transformed America’s political landscape.
Read MoreA detailed look at Native American population distribution across the United States, featuring custom-made maps that reveal concentration patterns from 1% to 90% and historical changes from 1990 to 2022. Based on comprehensive U.S. Census data analysis.
Read MoreThrough detailed animated maps based on U.S. Census data, we examine the geographic distribution of Asian Americans across U.S. counties, revealing dramatic population changes from 1990 to 2022 and identifying major demographic centers.
Read More