The Price of Health: Analyzing Food Costs Across America
Food is at the heart of American culture, but maintaining a nutritious diet is becoming increasingly challenging for many due to the rising costs of healthier food options. This gap between the prices of healthy and unhealthy foods isn’t just a personal finance issue—it’s a public health concern with far-reaching consequences. To get a clearer picture of this problem, the PlushCare team conducted an in-depth analysis of food prices across the United States.
The Post-War Food Revolution: Unintended Consequences
After World War II, farming practices underwent a major transformation. According to a recent Food Foundation report, these changes were aimed at producing and selling “the most calories at the lowest cost.” While this approach met immediate post-war needs, it’s led to new problems. Today, we’re facing an abundance of cheap, processed foods that contribute to health issues and environmental damage.
The True Cost of Cheap Calories
At first glance, choosing less expensive, less nutritious foods might seem like a smart move for budget-conscious shoppers. However, this choice often backfires in the long run. A eye-opening Harvard study found that unhealthy diets add a whopping $50 billion to healthcare costs each year. And that’s not even counting the personal costs of health problems, lost income, and higher living expenses that often come with poor nutrition.
Mapping Healthy Food Costs: A State-by-State Breakdown
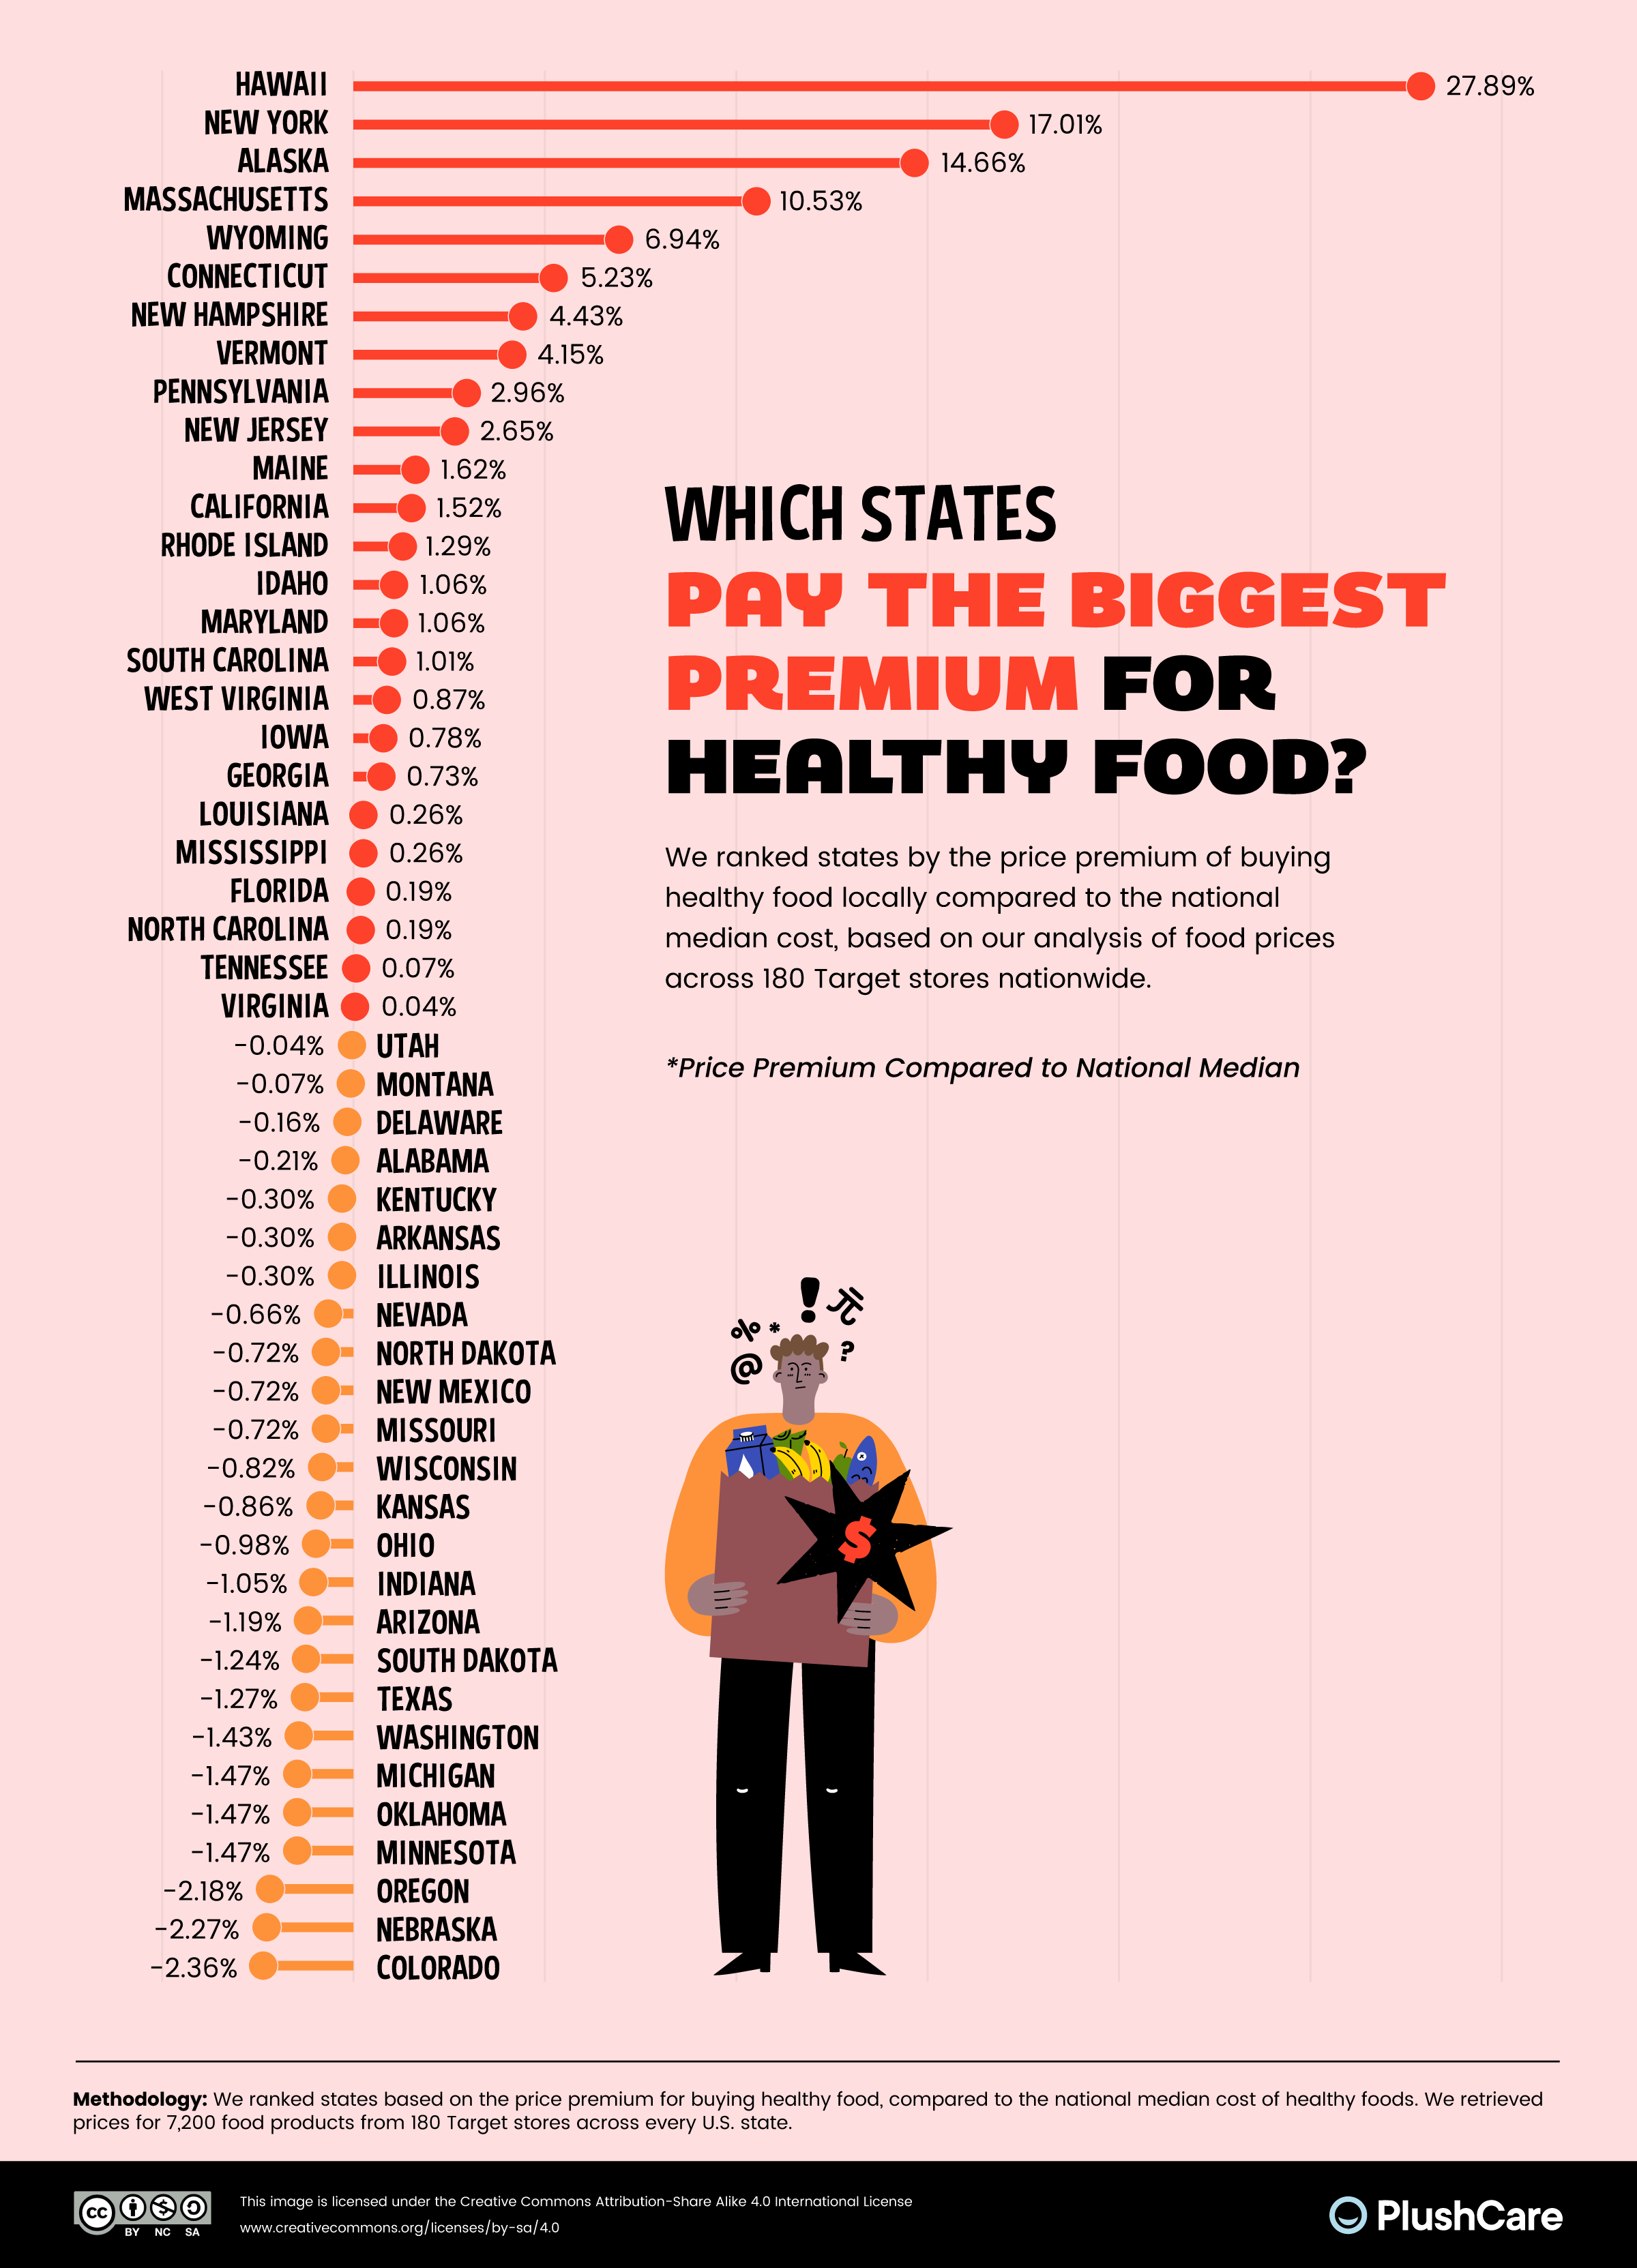
The PlushCare team set out to answer a key question: Just how much more does healthy food cost compared to less nutritious options?
How They Did It
The team carefully gathered price data for 20 healthy and 20 unhealthy food items (using Target’s store brands) across every state. They calculated the calorie content of each product, then grouped the data by state to compare the price per calorie for both healthy and unhealthy options. This allowed them to figure out the average cost of eating only healthy food in each state and see how affordable it is based on local average salaries.
Key Findings
The PlushCare team’s analysis turned up some surprising results:
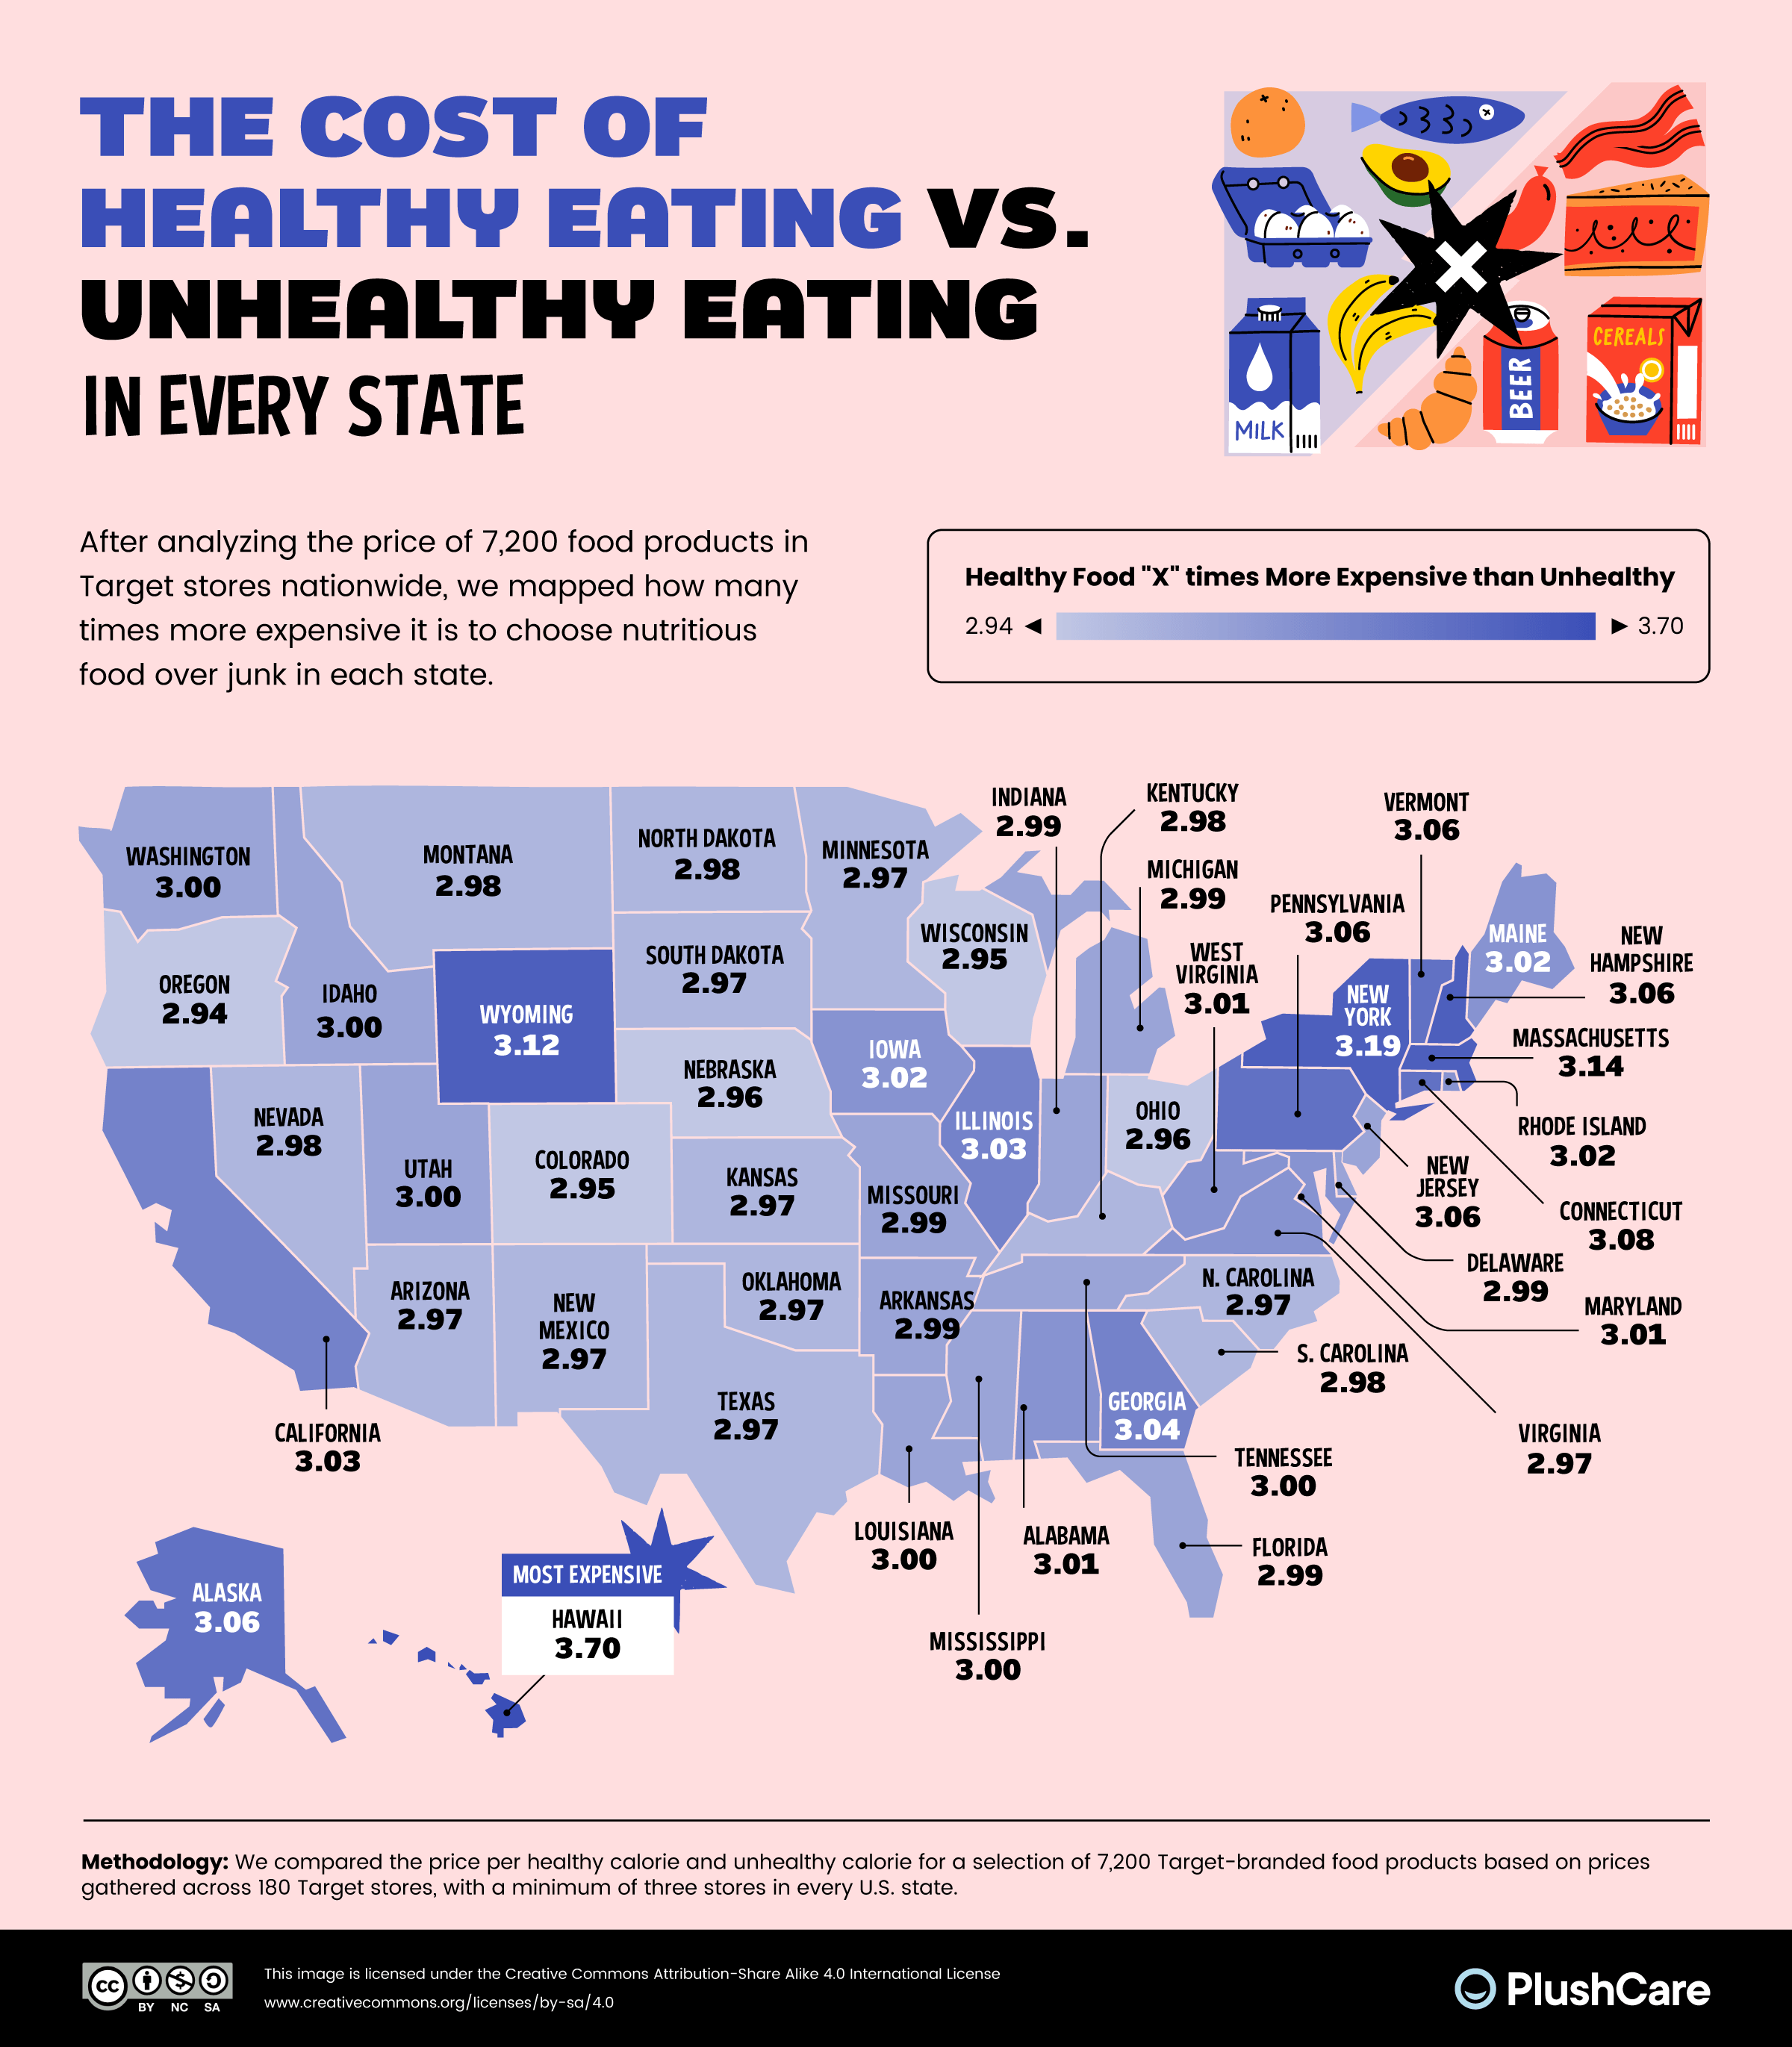
- Hawaii has the biggest price gap, with healthy foods costing 3.70 times more than unhealthy options—way above the national average of 3.02.
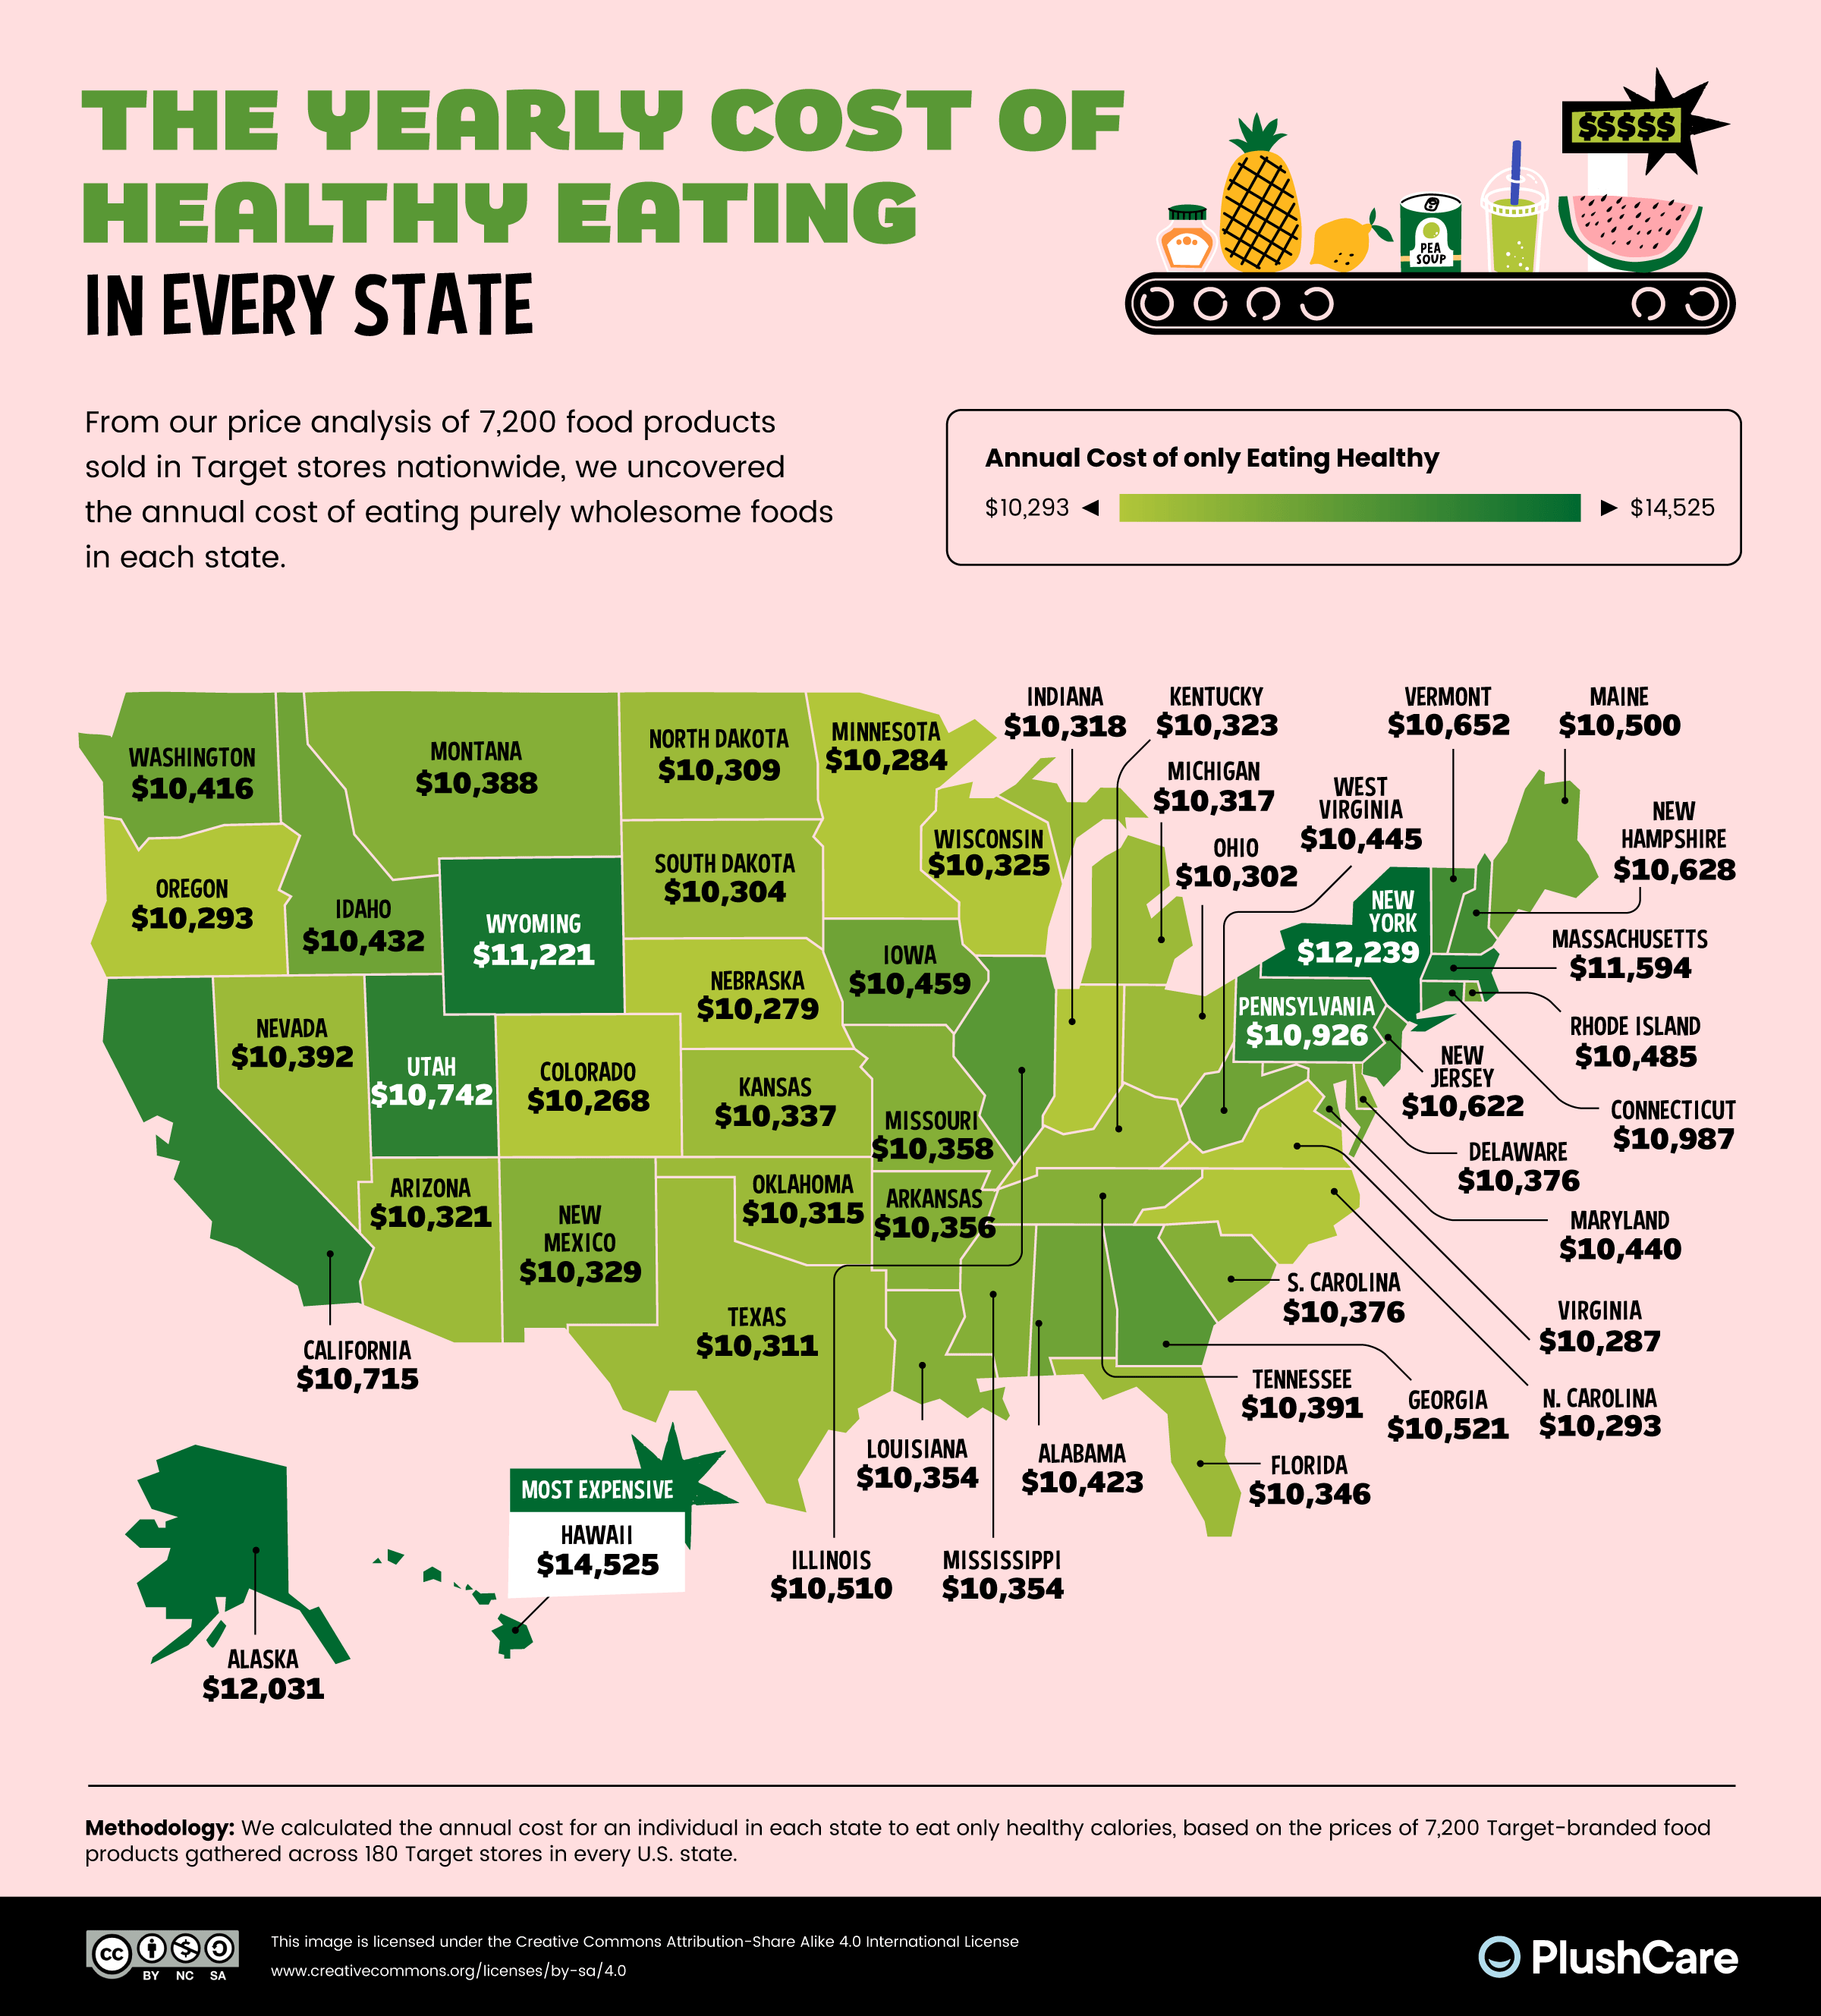
- New York has the second-highest yearly cost for healthy eating at $14,525—much higher than the national average of $10,614.
- Colorado is the bright spot, with the lowest yearly cost for a healthy diet at $10,268.
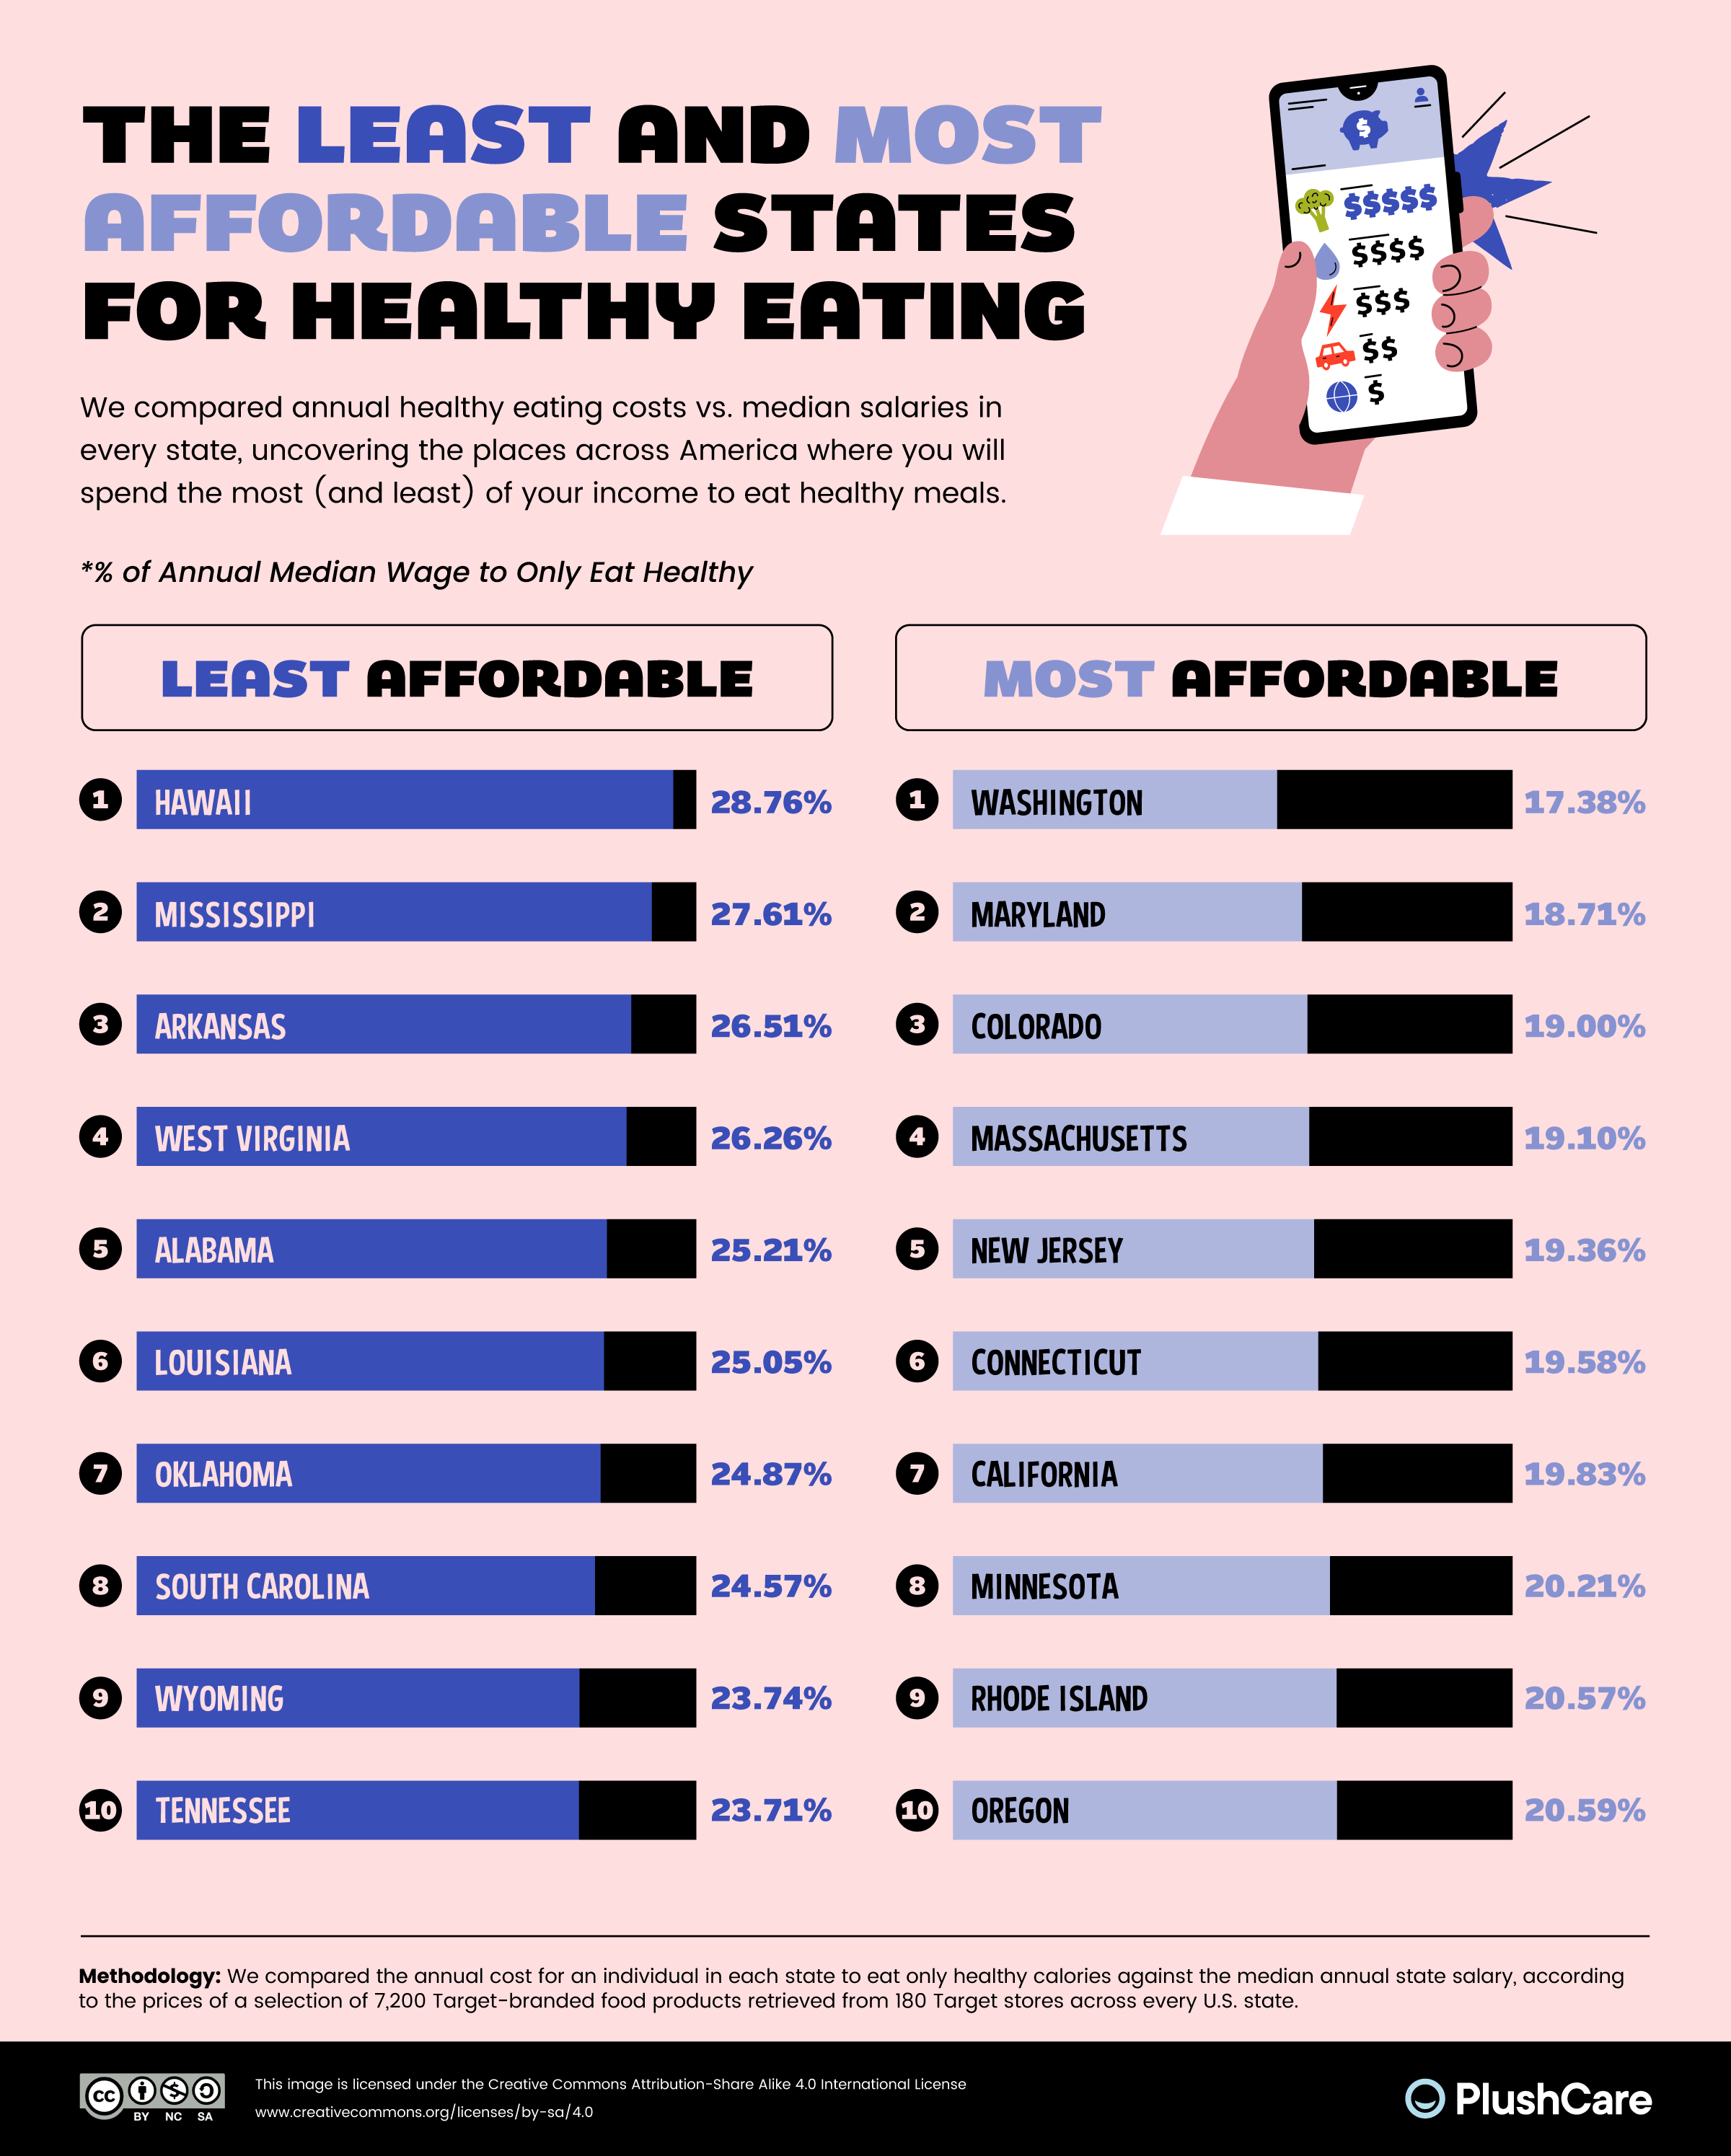
- Washington state offers the best balance of health and affordability, with a healthy diet costing just 17.38% of the average yearly salary.
A Closer Look at Regional Differences
Hawaii’s High Prices: An Island Challenge
Hawaii’s position as the priciest state for healthy eating mostly comes down to its isolation. Importing 85-90% of its food is expensive, especially for fresh produce. The state’s scattered islands also lead to big price differences between areas, making it even harder for rural residents or those working long hours to find affordable healthy food.
New York’s Healthy Food Landscape: A Tale of Two Cities
New York shows a complicated picture, with healthy food costing 3.19 times more than less healthy options. This difference is especially noticeable in wealthy areas and New York City, where you can find more variety in healthy foods—but often at much higher prices.
Colorado’s Surprising Affordability
While Colorado has the cheapest healthy food basket (2.36% below the national average), getting to that food is still a problem for some residents. About 11% of Coloradans struggle with food insecurity, and 5% of low-income residents live more than ten miles from a grocery store. Oddly enough, even in cities where stores are nearby, many lack healthy options.
Alaska: Unique Challenges in the Last Frontier
Alaska ranks third for healthy food costs, mainly because of its huge size and harsh weather. These factors make it hard to distribute and stock food, especially in remote areas. To help with this, programs like the USDA’s Food Distribution Program on Indian Reservations are working to improve access to traditional, healthy foods for Alaska Native communities.
Beyond Price: Can People Afford It?
When the PlushCare team factored in average salaries, they saw a different picture. Washington state, despite ranking 22nd in price, turns out to be the most affordable state for healthy eating because of higher average wages. This shows how important it is to consider local economic conditions when looking at food affordability.
Closing the Nutrition Gap
While the challenges are big, there are steps people can take to improve their diets. The USDA’s Dietary Guidelines for Americans (2020-2025) offers some practical tips:
- Fill half your plate with fruits and vegetables
- Mix up your produce choices
- Make at least half of your grains whole grains
- Cut down on added sugars, saturated fats, and sodium
- Watch your portion sizes
In the end, creating a culture of mindful eating and nutrition education at home might be our best tool for overcoming these dietary challenges.
How They Did It: Methods and Sources
The PlushCare team’s thorough study, finished in July 2024, followed these steps:
- They picked 20 healthy and 20 unhealthy products based on recommendations from the American Journal of Lifestyle Medicine and Harvard Health.
- Using Target’s store brands, they collected prices from at least three stores in every state, gathering data on 7,200 products across 180 locations.
- They figured out the total calories for each product using nutrition info or average serving sizes.
- They grouped the data by state to compare prices per healthy and unhealthy calorie.
- Using the DGA’s recommended yearly calorie intake, they calculated how much it would cost to eat only healthy food for a year in each state.
- They looked at affordability by comparing these costs to median state salaries.
- They ranked states based on how much more expensive healthy food was compared to the national median.
This analysis by the PlushCare team gives us a comprehensive look at the economic landscape of healthy eating across America, showing how geography, economics, and nutrition all play a part in what we eat.


")


