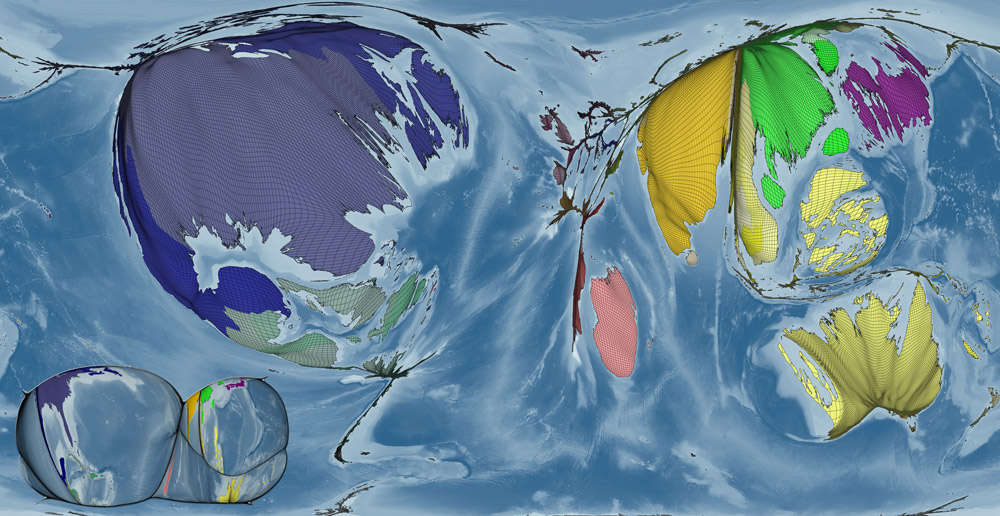
Benjamin Hennig maps the typhoons and cyclones created by the world’s weather systems.
For this cartogram, the observed tracks of storms (from 1945 to 2008) were analysed and their frequency and intensity was plotted onto a grid which provided the basis for the map transformation.


 by 2050?")
