When you look at a United States map, you might see 50 states that make up one nation. But looking at it through an economic lens tells a different story – one where individual states rival some of the world’s largest economies.
The Economic Giants: California, Texas, and New York
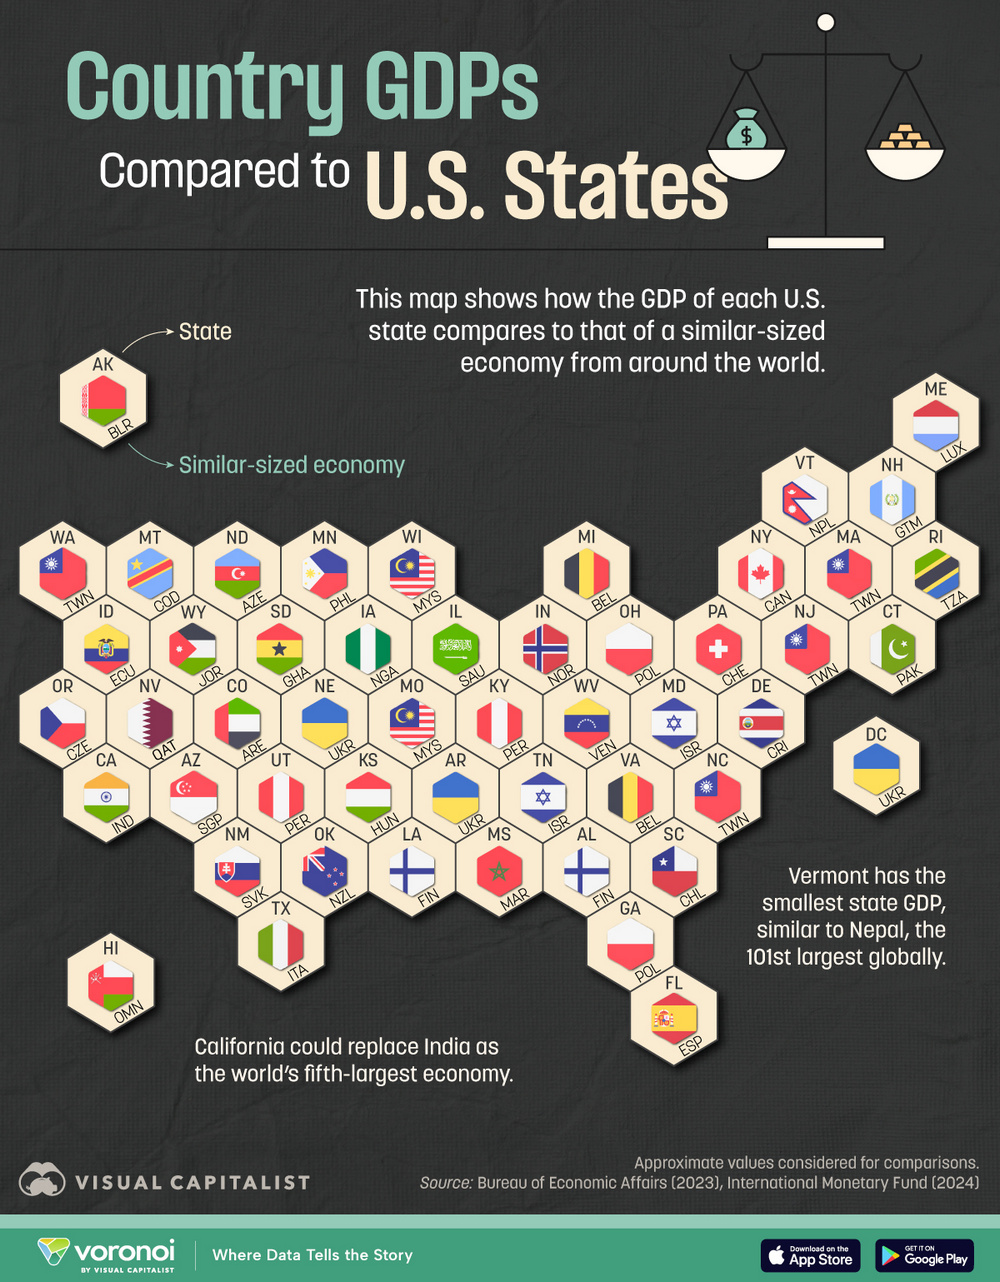
California stands as an economic powerhouse that would rank as the world’s 5th largest economy if it were an independent nation. With a GDP of $3.9 trillion, California’s economy matches India’s – but achieves this with just 3% of India’s population. The state’s success stems from its diverse economic sectors, including technology, entertainment, agriculture, and international trade through its major ports.
Texas, with its $2.6 trillion economy, parallels Italy, while New York matches Canada with $2.2 trillion. According to the U.S. Bureau of Economic Analysis, these three states alone contribute nearly 30% of America’s total GDP.
A Half-Century of Economic Evolution
An illuminating analysis by CashNetUSA shows how dramatically the economic landscape has shifted since the 1960s. Their animated visualization of state economies reveals fascinating trends: Florida and Georgia emerged as economic powerhouses despite not being in the top 10 during the 1960s, while Texas made a remarkable climb to become the nation’s second-largest economy.
Regional Economic Powerhouses
The economic strength of U.S. states extends well beyond the top three. Florida’s $1.6 trillion economy equals Spain’s entire economic output, while Illinois matches Saudi Arabia at $1.1 trillion. Pennsylvania, with its diverse industrial base and strong service sector, generates economic activity comparable to Switzerland, while Washington state’s tech-driven economy rivals Taiwan.
Population vs. Economic Output: The Efficiency Factor
Some states demonstrate remarkable economic efficiency, producing outsized economic impact relative to their population. Massachusetts exemplifies this trend, generating 3.2% of the nation’s GDP with just 2% of the U.S. population. This efficiency stems from its concentration of prestigious universities, biotechnology firms, and financial services companies.
Washington state shows similar strength, producing 3.5% of U.S. GDP with only 2.3% of the population, powered by tech giants like Microsoft and Amazon, alongside traditional industries like aerospace and agriculture. Connecticut follows this pattern, with its insurance industry and investment firms helping it contribute 1.5% to GDP despite having just 1.1% of the population.
What This Means for America’s Economic Future
The United States’ distributed economic power across multiple specialized centers offers both opportunities and challenges for future growth:
Traditional powerhouse states are evolving rapidly. California’s Silicon Valley faces growing competition from emerging tech hubs in Texas, North Carolina’s Research Triangle, and Colorado’s Front Range. This spreading of tech talent and investment could reshape the economic map over the next decade.
Several “rising star” states are positioning themselves for future growth. Arizona and Utah are attracting technology companies with lower costs and business-friendly policies. Virginia is leveraging its proximity to Washington D.C. to build a strong data center and cybersecurity industry. Florida’s space coast is seeing renewed growth with the commercial space industry boom.
The shift to remote work could further redistribute economic power. States with lower living costs but high quality of life, like Idaho, Montana, and New Hampshire, are attracting skilled workers from expensive coastal hubs. This migration could boost these states’ economic output and potentially alter the current GDP rankings.
However, this economic dispersion also presents challenges. States heavily dependent on single industries – like Michigan with automotive or Nevada with tourism – will need to diversify to remain competitive. Climate change could impact state economies differently, potentially affecting agriculture in the Midwest and real estate in coastal areas.
The key to America’s future economic strength lies in this very diversity. While individual states may rise or fall in GDP rankings, the nation’s distributed economic centers provide resilience against regional downturns and foster healthy competition for innovation and growth.
The dynamics of state economies tell a fascinating story about America’s economic might. If you’d like to keep track of these geographic and economic relationships, a quality wall map can be both decorative and educational. Here are some highly-rated United States maps available through Amazon (affiliate links):